

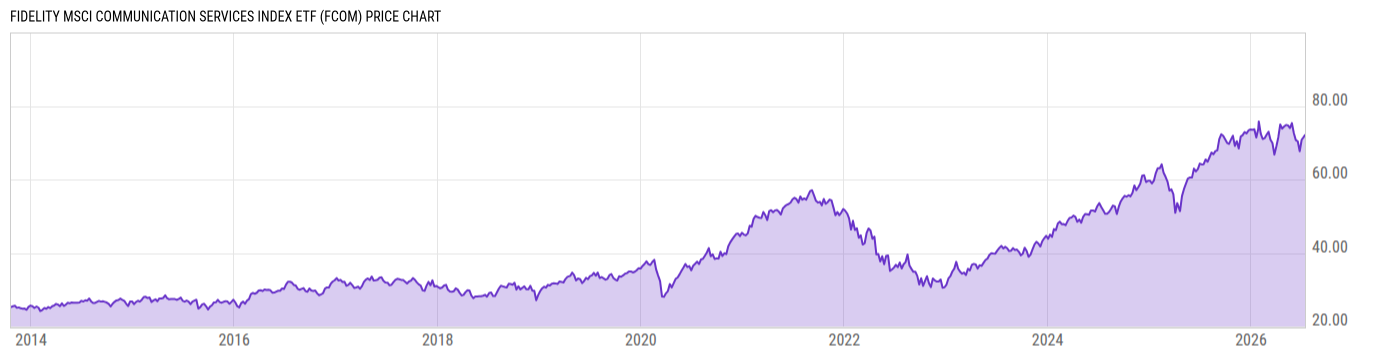
Fidelity MSCI Communication Services Index ETF (FCOM)
72.10
+0.12
(+0.16%)
USD |
NYSEARCA |
Jul 14, 16:00
72.10
0.00 (0.00%)
After-Hours: 20:00
Price Chart
Key Stats
| Net Expense Ratio | Discount or Premium to NAV | Total Assets Under Management | 30-Day Average Daily Volume |
|---|---|---|---|
| 0.08% | -0.01% | 1.839B | 199464.2 |
| Weighted Average Dividend Yield | Turnover Ratio (Generic) | 1 Year Fund Level Flows | Max Drawdown (Since Inception) |
| 1.09% | 13.00% | -70.31M |
Basic Info
| Investment Strategy | |
| The Fund seeks investment returns of the MSCI USA IMI Telecommunication Services 25/50 Index. The Fund will invest at least 80% of its assets in securities of MSCI USA IMI Telecommunication Services 25/50 Index which represents the performance of the telecommunication services sector in the U.S. equity market. |
| General | |
| Security Type | Exchange-Traded Fund |
| Equity Style | Multi Cap Core |
| Broad Asset Class | Sector Equity |
| Broad Category | Equity |
| Global Peer Group | Equity Sector Communication Services |
| Peer Group | Telecommunication Funds |
| Global Macro | Equity Industry Sector |
| US Macro | Sector Equity Funds |
| YCharts Categorization | -- |
| YCharts Benchmark | -- |
| Prospectus Objective | Telecommunication Funds |
| Fund Owner Firm Name | Fidelity Investments |
| Broad Asset Class Benchmark Index | |
| ^MSWNTR | 100.0% |
Performance Versus Peer Group
Annual Total Returns Versus Peers
As of July 14, 2026.
Asset Allocation
As of June 30, 2026.
| Type | % Net |
|---|---|
| Cash | 0.01% |
| Stock | 99.84% |
| Bond | 0.00% |
| Convertible | 0.00% |
| Preferred | 0.00% |
| Other | 0.14% |
Basic Info
| Investment Strategy | |
| The Fund seeks investment returns of the MSCI USA IMI Telecommunication Services 25/50 Index. The Fund will invest at least 80% of its assets in securities of MSCI USA IMI Telecommunication Services 25/50 Index which represents the performance of the telecommunication services sector in the U.S. equity market. |
| General | |
| Security Type | Exchange-Traded Fund |
| Equity Style | Multi Cap Core |
| Broad Asset Class | Sector Equity |
| Broad Category | Equity |
| Global Peer Group | Equity Sector Communication Services |
| Peer Group | Telecommunication Funds |
| Global Macro | Equity Industry Sector |
| US Macro | Sector Equity Funds |
| YCharts Categorization | -- |
| YCharts Benchmark | -- |
| Prospectus Objective | Telecommunication Funds |
| Fund Owner Firm Name | Fidelity Investments |
| Broad Asset Class Benchmark Index | |
| ^MSWNTR | 100.0% |