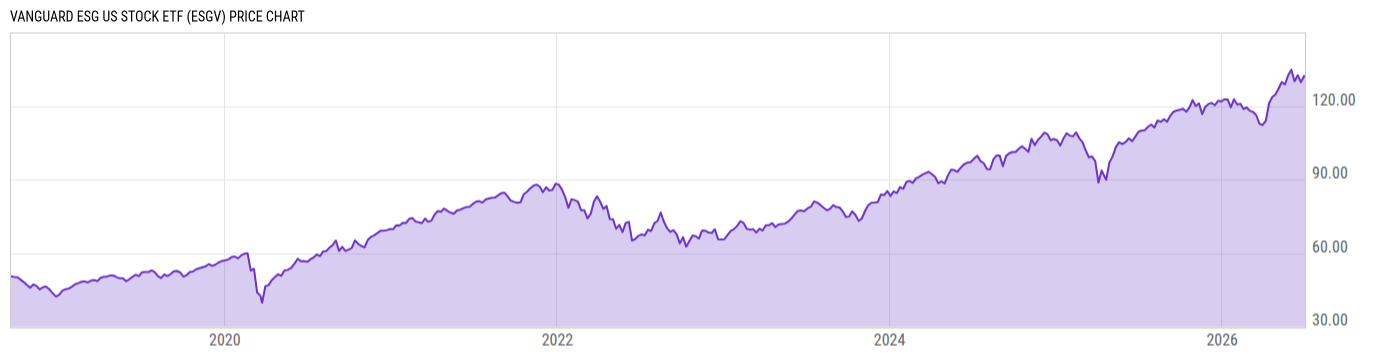
Vanguard ESG US Stock ETF (ESGV)
72.42
+0.07 (+0.10%)
USD |
Jan 21, 16:59
Price Chart
Key Stats
Customize
Expense Ratio | Discount or Premium to NAV | Total Assets Under Management | 30-Day Average Daily Volume |
---|---|---|---|
0.12% | 0.04% | 3.193B | 332765.3 |
Dividend Yield | Turnover Ratio | 1 Year Fund Level Flows | Max Drawdown (All) |
1.07% | 6.00% | 1.602B | Upgrade |
Basic Info
Investment Strategy | |
The investment seeks to track the performance of the FTSE US All Cap Choice Index. The adviser attempts to replicate the target index by investing all, or substantially all, of its assets in the stocks that make up the index, holding each stock in approximately the same proportion as its weighting in the index. The index, which is market-capitalization weighted, is composed of large-, mid-, and small-cap stocks of companies located in the United States that are screened for certain environmental, social, and corporate governance (ESG) criteria by the index sponsor, which is independent of Vanguard. |
General | |
Security Type | Exchange-Traded Fund |
Equity Style | Large Cap/Blend |
Fixed Income Style | -- |
Broad Asset Class | US Equity |
Broad Category | Equity |
Category Name | Large Blend |
Category Index | Russell 1000 TR USD |
Prospectus Objective | Growth and Income |
Fund Owner Firm Name | Vanguard |
Prospectus Benchmark Index | |
FTSE USA All Cap Choice TR USD | 100.0% |
Broad Asset Class Benchmark Index | |
^SPXTR | 100.0% |
Manager Tenure | |
Gerard O’Reilly | 2.29 yrs |
William Coleman | 2.29 yrs |
Net Fund Flows Versus Category
1 Month
% Rank:
--
--
Category Low
--
Category High
1 Year
% Rank:
3
1.602B
-25.66B
Category Low
10.63B
Category High
3 Months
% Rank:
--
--
Category Low
--
Category High
3 Years
% Rank:
--
--
Category Low
--
Category High
6 Months
% Rank:
--
--
Category Low
--
Category High
5 Years
% Rank:
--
--
Category Low
--
Category High
YTD
% Rank:
--
--
Category Low
--
Category High
10 Years
% Rank:
--
--
Category Low
--
Category High
As of December 31, 2020
Performance Versus Category
As of January 20, 2021. Returns for periods of 1 year and above are annualized.
Annual Total Returns Versus Peers
Edit comparables
As of January 20, 2021.
Asset Allocation
Top 10 Holdings
Name | % Weight | Price | % Change |
---|---|---|---|
Apple Inc | 6.71% | 137.29 | 3.98% |
Microsoft Corp | 5.22% | 225.10 | 0.34% |
Amazon.com Inc | 4.32% | 3308.13 | 1.37% |
Facebook Inc A | 2.06% | 273.28 | 2.17% |
Alphabet Inc Class C | 1.95% | 1891.24 | 0.23% |
Tesla Inc | 1.67% | 843.99 | -0.76% |
Alphabet Inc A | 1.29% | 1885.01 | 0.26% |
JPMorgan Chase & Co | 1.21% | 134.97 | -0.74% |
Visa Inc Class A | 1.16% | 205.25 | -0.37% |
Procter & Gamble Co | 1.06% | 131.00 | -0.70% |
News
Headline
Wire
Time (ET)
Basic Info
Investment Strategy | |
The investment seeks to track the performance of the FTSE US All Cap Choice Index. The adviser attempts to replicate the target index by investing all, or substantially all, of its assets in the stocks that make up the index, holding each stock in approximately the same proportion as its weighting in the index. The index, which is market-capitalization weighted, is composed of large-, mid-, and small-cap stocks of companies located in the United States that are screened for certain environmental, social, and corporate governance (ESG) criteria by the index sponsor, which is independent of Vanguard. |
General | |
Security Type | Exchange-Traded Fund |
Equity Style | Large Cap/Blend |
Fixed Income Style | -- |
Broad Asset Class | US Equity |
Broad Category | Equity |
Category Name | Large Blend |
Category Index | Russell 1000 TR USD |
Prospectus Objective | Growth and Income |
Fund Owner Firm Name | Vanguard |
Prospectus Benchmark Index | |
FTSE USA All Cap Choice TR USD | 100.0% |
Broad Asset Class Benchmark Index | |
^SPXTR | 100.0% |
Manager Tenure | |
Gerard O’Reilly | 2.29 yrs |
William Coleman | 2.29 yrs |
Fundamentals
General | |
Distribution Yield | Upgrade |
Dividend Yield TTM (1-21-21) | 1.07% |
30-Day SEC Yield (1-14-21) | Upgrade |
7-Day SEC Yield | -- |
Number of Holdings | Upgrade |
Stock | |
Weighted Average PE Ratio | 28.66 |
Weighted Average Price to Sales Ratio | Upgrade |
Weighted Average Price to Book Ratio | Upgrade |
Weighted Median ROE | Upgrade |
Weighted Median ROA | Upgrade |
Forecasted Dividend Yield | Upgrade |
Forecasted PE Ratio | Upgrade |
Forecasted Price to Sales Ratio | Upgrade |
Forecasted Price to Book Ratio | Upgrade |
As of December 31, 2020
Growth Estimates
Fund Details
Key Dates | |
Inception Date | 9/18/2018 |
Last Annual Report Date | 8/31/2020 |
Last Prospectus Date | 12/22/2020 |
Attributes | |
Enhanced Index Fund | No |
Index Fund |
|
Inverse Fund | No |
Leveraged Fund | No |
Fund of Funds | No |
Currency Hedged Fund | No |
Synthetic Replication Fund | No |
Has Dividend Investment Plan | No |
Socially Responsible Fund |
|
News
Headline
Wire
Time (ET)