

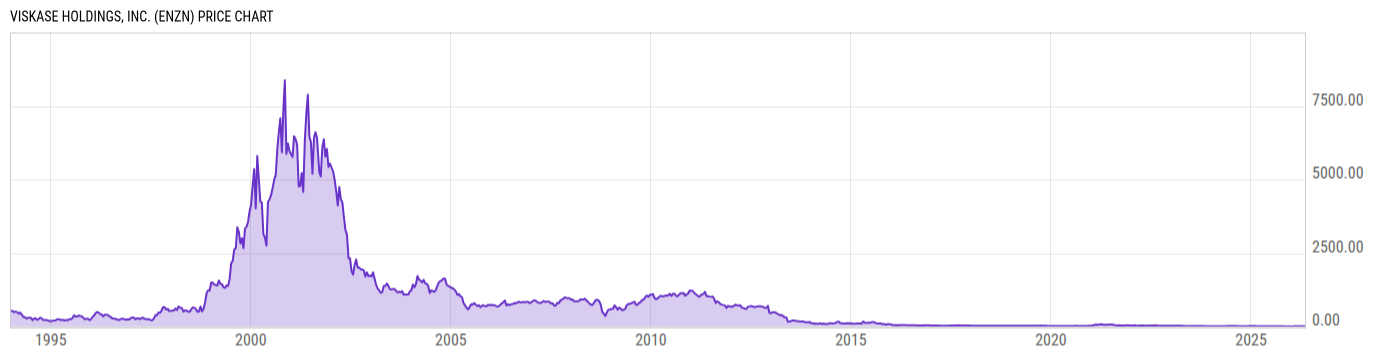
Viskase Holdings, Inc. (ENZN)
5.75
-0.10
(-1.71%)
USD |
OTCM |
Jun 08, 16:00
Price Chart
Key Stats
| Price and Performance | |
|---|---|
| Market Cap | 82.41M |
| 52 Week High (Daily) | |
| 52 Week Low (Daily) | |
| All-Time High (Daily) | |
| Year to Date Total Returns (Daily) | |
| 1 Month Total Returns (Daily) | |
| 1 Year Total Returns (Daily) | -32.51% |
| Valuation | |
| PE Ratio | -- |
| PE Ratio (Forward) | |
| PS Ratio | 0.1687 |
| Price to Book Value | 0.4288 |
| EV to EBITDA | |
| Dividend | |
|---|---|
| Dividend | -- |
| Dividend Yield (Forward) | |
| Financials | |
| Revenue (5 Year Growth) | |
| Revenue (Quarterly YoY Growth) | |
| EPS Diluted (5 Year Growth) | |
| EPS Diluted (Quarterly YoY Growth) | |
| Debt to Equity Ratio | 0.7888 |
| Return on Equity | |
| Return on Assets | |
| Risk | |
| Beta (5Y) | |
| Max Drawdown (5Y) | 95.81% |
Profile
| N/A |
| URL | http://www.viskase.com |
| Investor Relations URL | N/A |
| HQ State/Province | Illinois |
| Sector | Materials |
| Industry | Containers & Packaging |
| Next Earnings Release | N/A |
| Last Earnings Release | Nov. 03, 2022 |
| Next Ex-Dividend Date | N/A |
| Last Ex-Dividend Date | Sep. 30, 2019 |