

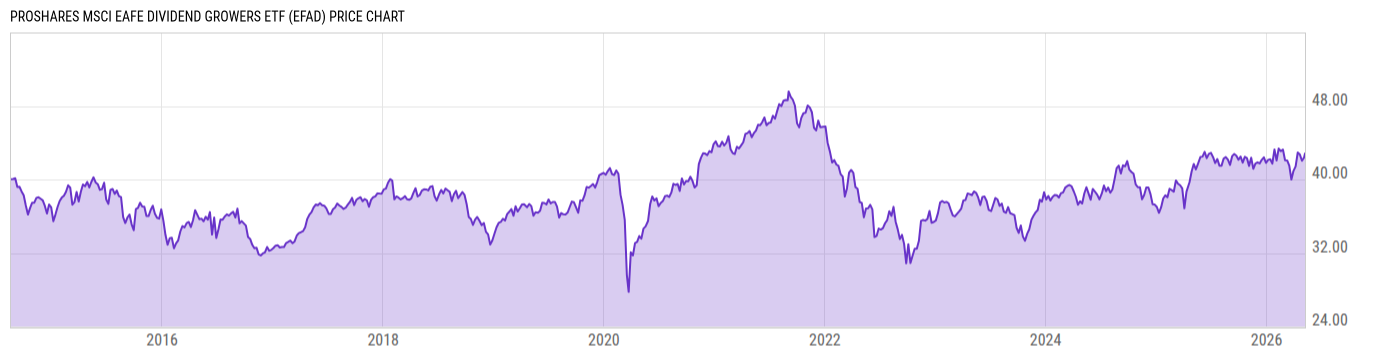
ProShares MSCI EAFE Dividend Growers ETF (EFAD)
43.17
+0.31
(+0.72%)
USD |
BATS |
May 29, 16:00
Price Chart
Key Stats
| Net Expense Ratio | Discount or Premium to NAV | Total Assets Under Management | 30-Day Average Daily Volume |
|---|---|---|---|
| 0.50% | -0.10% | 61.79M | 3570.03 |
| Weighted Average Dividend Yield | Turnover Ratio (Generic) | 1 Year Fund Level Flows | Max Drawdown (Since Inception) |
| 2.39% | 40.00% | -11.56M |
Basic Info
| Investment Strategy | |
| The Fund seeks investment results that track the performance of the MSCI EAFE Dividend Masters Index. The Fund will invest at least 80% of its total assets in component securities. It invests in the equity securities of companies domiciled in developed market countries, excluding the U.S. and Canada. |
| General | |
| Security Type | Exchange-Traded Fund |
| Equity Style | Multi Cap Growth |
| Broad Asset Class | International Equity |
| Broad Category | Equity |
| Global Peer Group | Equity Global ex US |
| Peer Group | International Multi-Cap Growth |
| Global Macro | Equity Global |
| US Macro | Developed International Markets Funds |
| YCharts Categorization | -- |
| YCharts Benchmark | -- |
| Prospectus Objective | International Funds |
| Fund Owner Firm Name | ProShares |
| Broad Asset Class Benchmark Index | |
| ^MSACXUSNTR | 100.0% |
Performance Versus Peer Group
Annual Total Returns Versus Peers
As of May 30, 2026.
Asset Allocation
As of April 30, 2026.
| Type | % Net |
|---|---|
| Cash | 0.37% |
| Stock | 98.79% |
| Bond | 0.00% |
| Convertible | 0.00% |
| Preferred | 0.00% |
| Other | 0.83% |
Basic Info
| Investment Strategy | |
| The Fund seeks investment results that track the performance of the MSCI EAFE Dividend Masters Index. The Fund will invest at least 80% of its total assets in component securities. It invests in the equity securities of companies domiciled in developed market countries, excluding the U.S. and Canada. |
| General | |
| Security Type | Exchange-Traded Fund |
| Equity Style | Multi Cap Growth |
| Broad Asset Class | International Equity |
| Broad Category | Equity |
| Global Peer Group | Equity Global ex US |
| Peer Group | International Multi-Cap Growth |
| Global Macro | Equity Global |
| US Macro | Developed International Markets Funds |
| YCharts Categorization | -- |
| YCharts Benchmark | -- |
| Prospectus Objective | International Funds |
| Fund Owner Firm Name | ProShares |
| Broad Asset Class Benchmark Index | |
| ^MSACXUSNTR | 100.0% |