

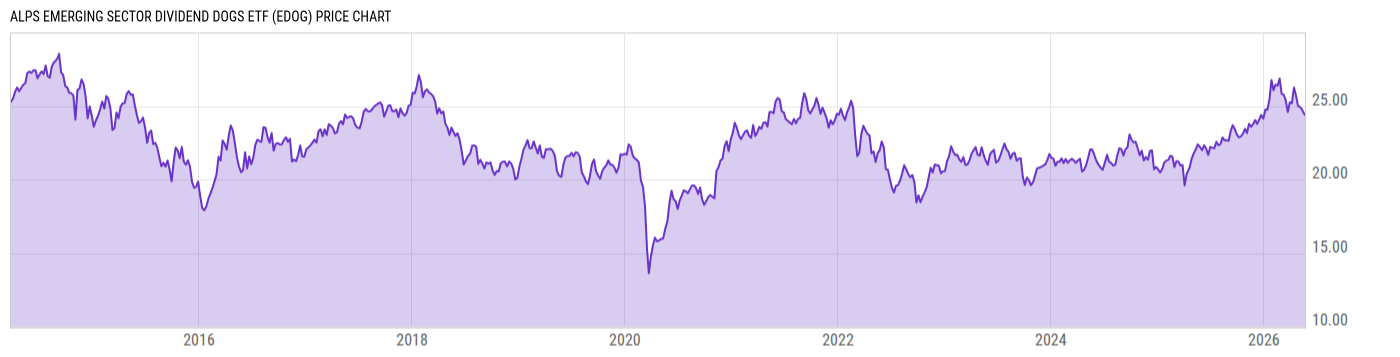
Alps Emerging Sector Dividend Dogs ETF (EDOG)
24.06
+0.17
(+0.72%)
USD |
NYSEARCA |
Jun 09, 16:00
Price Chart
Key Stats
| Net Expense Ratio | Discount or Premium to NAV | Total Assets Under Management | 30-Day Average Daily Volume |
|---|---|---|---|
| 0.60% | 0.43% | 28.75M | 2187.63 |
| Weighted Average Dividend Yield | Turnover Ratio (Generic) | 1 Year Fund Level Flows | Max Drawdown (Since Inception) |
| 7.27% | 74.00% | -1.298M |
Basic Info
| Investment Strategy | |
| The Fund seeks investment results that replicate as closely as possible the performance of the S-Network Emerging Sector Dividend Dogs Index. It is a rules-based index intended to give investors a means of tracking the overall performance of the highest dividend paying stocks in the S-Network Emerging Markets Index. |
| General | |
| Security Type | Exchange-Traded Fund |
| Equity Style | Multi Cap Value |
| Broad Asset Class | International Equity |
| Broad Category | Equity |
| Global Peer Group | Equity Global Income |
| Peer Group | Global Equity Income Funds |
| Global Macro | Equity Global |
| US Macro | Developed Global Markets Funds |
| YCharts Categorization | -- |
| YCharts Benchmark | -- |
| Prospectus Objective | Global Funds |
| Fund Owner Firm Name | SS&C ALPS Advisors |
| Broad Asset Class Benchmark Index | |
| ^MSACXUSNTR | 100.0% |
Performance Versus Peer Group
Annual Total Returns Versus Peers
As of June 10, 2026.
Asset Allocation
As of May 31, 2026.
| Type | % Net |
|---|---|
| Cash | 0.01% |
| Stock | 93.53% |
| Bond | 0.00% |
| Convertible | 0.00% |
| Preferred | 6.01% |
| Other | 0.44% |
Basic Info
| Investment Strategy | |
| The Fund seeks investment results that replicate as closely as possible the performance of the S-Network Emerging Sector Dividend Dogs Index. It is a rules-based index intended to give investors a means of tracking the overall performance of the highest dividend paying stocks in the S-Network Emerging Markets Index. |
| General | |
| Security Type | Exchange-Traded Fund |
| Equity Style | Multi Cap Value |
| Broad Asset Class | International Equity |
| Broad Category | Equity |
| Global Peer Group | Equity Global Income |
| Peer Group | Global Equity Income Funds |
| Global Macro | Equity Global |
| US Macro | Developed Global Markets Funds |
| YCharts Categorization | -- |
| YCharts Benchmark | -- |
| Prospectus Objective | Global Funds |
| Fund Owner Firm Name | SS&C ALPS Advisors |
| Broad Asset Class Benchmark Index | |
| ^MSACXUSNTR | 100.0% |