

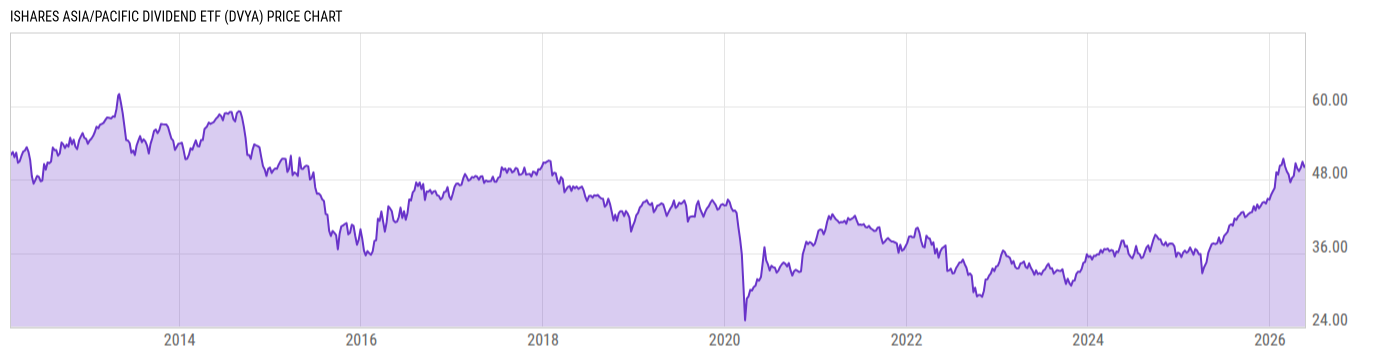
iShares Asia/Pacific Dividend ETF (DVYA)
50.25
-0.36
(-0.71%)
USD |
NYSEARCA |
May 22, 16:00
Price Chart
Key Stats
| Net Expense Ratio | Discount or Premium to NAV | Total Assets Under Management | 30-Day Average Daily Volume |
|---|---|---|---|
| 0.49% | -0.22% | 70.51M | 5379.10 |
| Weighted Average Dividend Yield | Turnover Ratio (Generic) | 1 Year Fund Level Flows | Max Drawdown (Since Inception) |
| 4.72% | 26.00% | 11.04M |
Basic Info
| Investment Strategy | |
| The Fund seeks investment result that correspond to the price and yield performance of Dow Jones Asia/Pacific Select Dividend 30 Index. The Index measures the performance of high dividend paying companies in Australia, Hong Kong, New Zealand, and Singapore. |
| General | |
| Security Type | Exchange-Traded Fund |
| Equity Style | Multi Cap Value |
| Broad Asset Class | International Equity |
| Broad Category | Equity |
| Global Peer Group | Equity Asia Pacific |
| Peer Group | International Equity Income Funds |
| Global Macro | Equity Asia Pacific |
| US Macro | Developed International Markets Funds |
| YCharts Categorization | -- |
| YCharts Benchmark | -- |
| Prospectus Objective | Pacific Region Funds |
| Fund Owner Firm Name | BlackRock |
| Broad Asset Class Benchmark Index | |
| ^MSACXUSNTR | 100.0% |
Performance Versus Peer Group
Annual Total Returns Versus Peers
As of May 23, 2026.
Asset Allocation
As of April 30, 2026.
| Type | % Net |
|---|---|
| Cash | 0.23% |
| Stock | 99.14% |
| Bond | 0.02% |
| Convertible | 0.00% |
| Preferred | 0.00% |
| Other | 0.61% |
Basic Info
| Investment Strategy | |
| The Fund seeks investment result that correspond to the price and yield performance of Dow Jones Asia/Pacific Select Dividend 30 Index. The Index measures the performance of high dividend paying companies in Australia, Hong Kong, New Zealand, and Singapore. |
| General | |
| Security Type | Exchange-Traded Fund |
| Equity Style | Multi Cap Value |
| Broad Asset Class | International Equity |
| Broad Category | Equity |
| Global Peer Group | Equity Asia Pacific |
| Peer Group | International Equity Income Funds |
| Global Macro | Equity Asia Pacific |
| US Macro | Developed International Markets Funds |
| YCharts Categorization | -- |
| YCharts Benchmark | -- |
| Prospectus Objective | Pacific Region Funds |
| Fund Owner Firm Name | BlackRock |
| Broad Asset Class Benchmark Index | |
| ^MSACXUSNTR | 100.0% |