

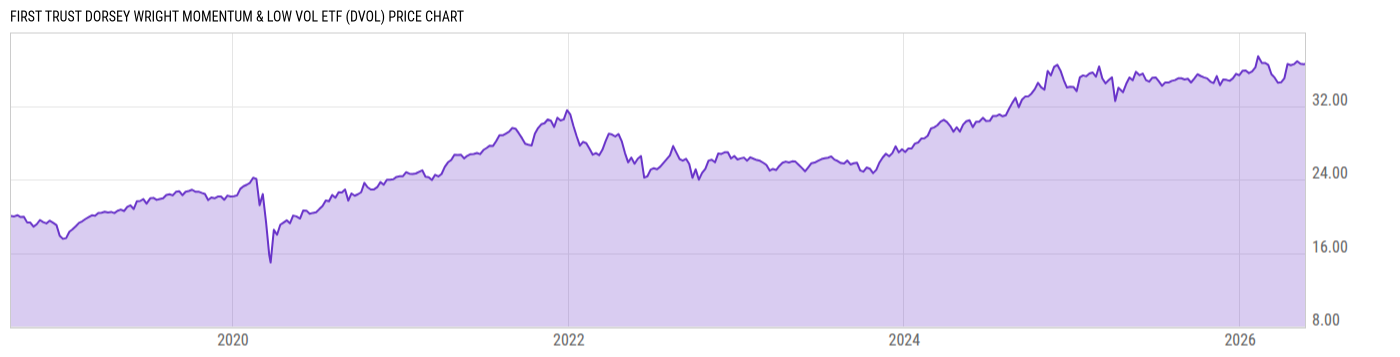
First Trust Dorsey Wright Momentum & Low Vol ETF (DVOL)
36.39
-0.23
(-0.62%)
USD |
NASDAQ |
May 21, 16:00
Price Chart
Key Stats
| Net Expense Ratio | Discount or Premium to NAV | Total Assets Under Management | 30-Day Average Daily Volume |
|---|---|---|---|
| 0.60% | 0.03% | 74.58M | 9608.27 |
| Weighted Average Dividend Yield | Turnover Ratio (Generic) | 1 Year Fund Level Flows | Max Drawdown (Since Inception) |
| 1.99% | 152.0% | 6.077M |
Basic Info
| Investment Strategy | |
| The Fund seeks investment results that correspond to the Dorsey Wright Momentum Plus Low Volatility Index. The Index is designed to track the performance of 50 stocks comprising the NASDAQ US Large Mid Index that exhibit lowest levels of volatility while still maintaining high levels of relative strength. |
| General | |
| Security Type | Exchange-Traded Fund |
| Equity Style | Multi Cap Core |
| Broad Asset Class | US Equity |
| Broad Category | Equity |
| Global Peer Group | Equity US |
| Peer Group | Multi-Cap Core Funds |
| Global Macro | Equity North America |
| US Macro | Multi-Cap Funds |
| YCharts Categorization | -- |
| YCharts Benchmark | -- |
| Prospectus Objective | Growth & Income Funds |
| Fund Owner Firm Name | First Trust |
| Broad Asset Class Benchmark Index | |
| ^SPXTR | 100.0% |
Performance Versus Peer Group
Annual Total Returns Versus Peers
As of May 22, 2026.
Asset Allocation
As of April 30, 2026.
| Type | % Net |
|---|---|
| Cash | 0.14% |
| Stock | 99.91% |
| Bond | 0.00% |
| Convertible | 0.00% |
| Preferred | 0.00% |
| Other | -0.05% |
Basic Info
| Investment Strategy | |
| The Fund seeks investment results that correspond to the Dorsey Wright Momentum Plus Low Volatility Index. The Index is designed to track the performance of 50 stocks comprising the NASDAQ US Large Mid Index that exhibit lowest levels of volatility while still maintaining high levels of relative strength. |
| General | |
| Security Type | Exchange-Traded Fund |
| Equity Style | Multi Cap Core |
| Broad Asset Class | US Equity |
| Broad Category | Equity |
| Global Peer Group | Equity US |
| Peer Group | Multi-Cap Core Funds |
| Global Macro | Equity North America |
| US Macro | Multi-Cap Funds |
| YCharts Categorization | -- |
| YCharts Benchmark | -- |
| Prospectus Objective | Growth & Income Funds |
| Fund Owner Firm Name | First Trust |
| Broad Asset Class Benchmark Index | |
| ^SPXTR | 100.0% |