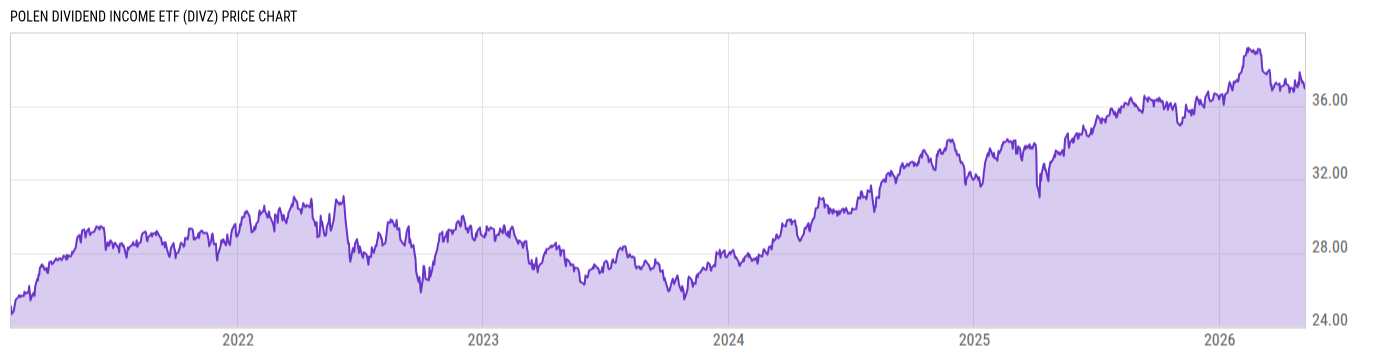
TrueShares Low Volatility Equity Inc ETF (DIVZ)
27.21
+0.26
(+0.97%)
USD |
NYSEARCA |
Mar 24, 16:00
27.21
0.00 (0.00%)
After-Hours: 17:55
Key Stats
Expense Ratio | Discount or Premium to NAV | Total Assets Under Management | 30-Day Average Daily Volume |
---|---|---|---|
0.65% | 0.09% | 65.70M | 31430.63 |
Dividend Yield | Turnover Ratio | 1 Year Fund Level Flows | Max Drawdown (All) |
2.65% | 41.00% | 31.79M | Upgrade |
Basic Info
Investment Strategy | |
The investment seeks to provide capital appreciation with lower volatility and a higher dividend yield compared to the S&P 500 Index. The fund is an actively-managed ETF that seeks to achieve its investment objective by purchasing 25-35 stocks of companies that pay dividends and expect to grow the dividends over time and are trading at attractive valuations at the time of the investment. Under normal circumstances, at least 80% of its net assets, plus borrowings for investment purposes, will be invested in equity securities, including common stocks and American Depositary Receipts ("ADRs"). The fund is non-diversified. |
General | |
Security Type | Exchange-Traded Fund |
Equity Style | Large Cap/Value |
Fixed Income Style | -- |
Broad Asset Class | US Equity |
Broad Category | Equity |
Category Name | Large Value |
Category Index | Russell 1000 Value TR USD |
Global Category Name | US Equity Large Cap Value |
YCharts Categorization | US Large Cap Value |
YCharts Benchmark | Russell 1000 Value Total Return (^RLVTR) |
Prospectus Objective | Equity-Income |
Fund Owner Firm Name | TrueShares |
Prospectus Benchmark Index | |
N/A | 100.0% |
Broad Asset Class Benchmark Index | |
^SPXTR | 100.0% |
Manager Tenure | |
Austin Graff | 2.09 yrs |
Net Fund Flows Versus Category
1 Month
% Rank:
--
--
Category Low
--
Category High
1 Year
% Rank:
22
31.79M
-6.415B
Category Low
13.81B
Category High
3 Months
% Rank:
--
--
Category Low
--
Category High
3 Years
% Rank:
--
--
Category Low
--
Category High
6 Months
% Rank:
--
--
Category Low
--
Category High
5 Years
% Rank:
--
--
Category Low
--
Category High
YTD
% Rank:
--
--
Category Low
--
Category High
10 Years
% Rank:
--
--
Category Low
--
Category High
As of February 28, 2023
Risk
Performance Versus Category
As of March 23, 2023. Returns for periods of 1 year and above are annualized.
Annual Total Returns Versus Peers
As of March 23, 2023.
Asset Allocation
Top 10 Holdings
Name | % Weight | Price | % Change |
---|---|---|---|
AbbVie Inc | 4.71% | 158.06 | 1.78% |
Lockheed Martin Corp | 4.50% | 474.42 | 1.39% |
American Electric Power Co Inc | 4.30% | 89.10 | 4.32% |
Verizon Communications Inc | 4.24% | 37.68 | 0.83% |
UnitedHealth Group Inc | 4.11% | 476.02 | 1.30% |
Exxon Mobil Corp | 4.04% | 103.52 | 0.11% |
AT&T Inc | 4.02% | 18.62 | 0.87% |
Charles Schwab Corp | 4.02% | 53.25 | 0.68% |
Johnson & Johnson | 4.01% | 152.66 | 1.01% |
FirstEnergy Corp | 3.92% | 39.19 | 3.81% |
News
Headline
Wire
Time (ET)
Basic Info
Investment Strategy | |
The investment seeks to provide capital appreciation with lower volatility and a higher dividend yield compared to the S&P 500 Index. The fund is an actively-managed ETF that seeks to achieve its investment objective by purchasing 25-35 stocks of companies that pay dividends and expect to grow the dividends over time and are trading at attractive valuations at the time of the investment. Under normal circumstances, at least 80% of its net assets, plus borrowings for investment purposes, will be invested in equity securities, including common stocks and American Depositary Receipts ("ADRs"). The fund is non-diversified. |
General | |
Security Type | Exchange-Traded Fund |
Equity Style | Large Cap/Value |
Fixed Income Style | -- |
Broad Asset Class | US Equity |
Broad Category | Equity |
Category Name | Large Value |
Category Index | Russell 1000 Value TR USD |
Global Category Name | US Equity Large Cap Value |
YCharts Categorization | US Large Cap Value |
YCharts Benchmark | Russell 1000 Value Total Return (^RLVTR) |
Prospectus Objective | Equity-Income |
Fund Owner Firm Name | TrueShares |
Prospectus Benchmark Index | |
N/A | 100.0% |
Broad Asset Class Benchmark Index | |
^SPXTR | 100.0% |
Manager Tenure | |
Austin Graff | 2.09 yrs |
Fundamentals
General | |
Distribution Yield | Upgrade |
Dividend Yield TTM (3-24-23) | 2.65% |
30-Day SEC Yield | -- |
7-Day SEC Yield | -- |
Number of Holdings | Upgrade |
Stock | |
Weighted Average PE Ratio | 14.40 |
Weighted Average Price to Sales Ratio | Upgrade |
Weighted Average Price to Book Ratio | Upgrade |
Weighted Median ROE | Upgrade |
Weighted Median ROA | Upgrade |
Forecasted Dividend Yield | Upgrade |
Forecasted PE Ratio | Upgrade |
Forecasted Price to Sales Ratio | Upgrade |
Forecasted Price to Book Ratio | Upgrade |
As of March 22, 2023
Fund Details
Key Dates | |
Inception Date | 1/27/2021 |
Last Annual Report Date | 12/31/2022 |
Last Prospectus Date | 4/30/2022 |
Attributes | |
Index Fund | No |
Inverse Fund | No |
Leveraged Fund | No |
Fund of Funds | No |
Currency Hedged Fund | No |
Synthetic Replication Fund | No |
Has Dividend Investment Plan | No |
Socially Responsible Fund | No |
News
Headline
Wire
Time (ET)