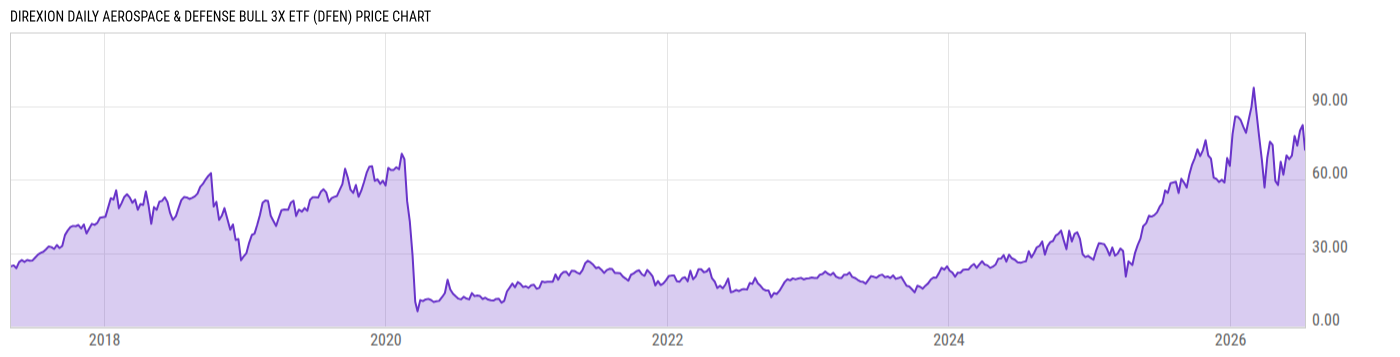
Key Stats

Expense Ratio Discount or Premium to NAV Total Assets Under Management 30-Day Average Daily Volume
0.97% 0.00% 182.55M 226800.4
Dividend Yield Turnover Ratio 1 Year Fund Level Flows Max Drawdown (All)
0.65% 77.00% -100.26M Upgrade

Basic Info

Investment Strategy
The investment seeks daily investment results, before fees and expenses, of 300% of the daily performance of the Dow Jones U.S. Select Aerospace & Defense Index. The fund invests at least 80% of its net assets (plus borrowing for investment purposes) in financial instruments, such as swap agreements, and securities of the index, ETFs that track the index and other financial instruments that provide daily leveraged exposure to the index or ETFs that track the index. The index attempts to measure the performance of the aerospace and defense industry of the U.S. equity market. The fund is non-diversified.
General
Security Type Exchange-Traded Fund
Equity Style Large Cap/Blend
Fixed Income Style --
Broad Asset Class Miscellaneous
Broad Category Miscellaneous
Category Name Trading--Leveraged Equity
Category Index S&P 500 TR USD
Global Category Name Trading Tools
YCharts Categorization Other
YCharts Benchmark S&P 500 Total Return (^SPXTR)
Prospectus Objective Specialty - Unaligned
Fund Owner Firm Name Direxion Funds
Prospectus Benchmark Index
DJ US Select Aerospace&Defense TR USD 300.0%
Broad Asset Class Benchmark Index
^SPXTR 100.0%
Manager Tenure
Paul Brigandi 5.83 yrs
Tony Ng 5.83 yrs

Net Fund Flows Versus Category

View Net Fund Flows. Upgrade now.
1M
3M
6M
YTD
1Y
3Y
5Y
10Y
 
80.00B
60.00B
40.00B
20.00B
0
-20.00B
1 Month
% Rank: --
-- Category Low
-- Category High
1 Year
% Rank: 97
-100.26M
-474.20M Category Low
4.729B Category High
3 Months
% Rank: --
-- Category Low
-- Category High
3 Years
% Rank: --
-- Category Low
-- Category High
6 Months
% Rank: --
-- Category Low
-- Category High
5 Years
% Rank: --
-- Category Low
-- Category High
YTD
% Rank: --
-- Category Low
-- Category High
10 Years
% Rank: --
-- Category Low
-- Category High
As of February 28, 2023

Performance Versus Category

 
20%
15%
10%
5%
0
View Category Returns. Upgrade now.
Name
1M
3M
YTD
1Y
3Y
5Y
10Y
15Y
Total Return (Price)
--
--
--
--
--
--
--
--
Total Return (NAV)
--
--
--
--
--
--
--
--
Category Rtn. (NAV)
--
--
--
--
--
--
--
--
% Rank in Cat (NAV)
--
--
--
--
--
--
--
--
As of March 31, 2023. Returns for periods of 1 year and above are annualized.

Annual Total Returns Versus Peers

Loading chart...
Name
2016
2017
2018
2019
2020
2021
2022
YTD
--
--
-32.87%
95.10%
-70.33%
12.76%
6.99%
5.11%
11.96%
21.83%
-4.38%
31.49%
18.40%
28.71%
-18.11%
7.50%
31.59%
59.56%
-13.48%
47.99%
2.12%
41.97%
-19.47%
-0.22%
31.36%
39.28%
-22.64%
66.16%
-20.34%
67.89%
-32.10%
-7.17%
70.34%
-11.60%
-55.94%
17.14%
-91.59%
111.8%
130.7%
-11.68%
35.77%
51.81%
-28.15%
67.44%
16.34%
34.64%
-32.90%
4.58%
As of March 31, 2023.

Fundamentals

General
Distribution Yield Upgrade
Dividend Yield TTM (3-31-23) 0.65%
30-Day SEC Yield --
7-Day SEC Yield --
Number of Holdings Upgrade
Stock
Weighted Average PE Ratio 26.51
Weighted Average Price to Sales Ratio Upgrade
Weighted Average Price to Book Ratio Upgrade
Weighted Median ROE Upgrade
Weighted Median ROA Upgrade
Forecasted Dividend Yield Upgrade
Forecasted PE Ratio Upgrade
Forecasted Price to Sales Ratio Upgrade
Forecasted Price to Book Ratio Upgrade
As of March 29, 2023

Growth Estimates

Forecasted 5 Yr Earnings Growth Upgrade
Forecasted Book Value Growth Upgrade
Forecasted Cash Flow Growth Upgrade
Forecasted Earnings Growth Upgrade
Forecasted Revenue Growth Upgrade
As of March 29, 2023

Asset Allocation

As of March 29, 2023.
Type % Net % Long % Short
Cash 22.93% Upgrade Upgrade
Stock 71.22% Upgrade Upgrade
Bond 0.00% Upgrade Upgrade
Convertible 0.00% Upgrade Upgrade
Preferred 0.00% Upgrade Upgrade
Other 5.85% Upgrade Upgrade

Top 10 Holdings

Name % Weight Price % Change
Dreyfus Government Secs Cash Mgmt Admin 23.61% 1.00 0.00%
Raytheon Technologies Corp 13.50% 97.93 0.58%
Boeing Co 11.03% 212.43 0.66%
Dow Jones U.S Select Aero Def Index Swap
6.19% -- --
Goldman Sachs Sterling FixInc Port Inc
5.85% -- --
Lockheed Martin Corp 5.17% 472.73 -0.10%
General Dynamics Corp 2.96% 228.21 0.76%
Northrop Grumman Corp 2.94% 461.72 0.16%
TransDigm Group Inc 2.84% 737.05 0.30%
Howmet Aerospace Inc 2.81% 42.37 1.03%

Basic Info

Investment Strategy
The investment seeks daily investment results, before fees and expenses, of 300% of the daily performance of the Dow Jones U.S. Select Aerospace & Defense Index. The fund invests at least 80% of its net assets (plus borrowing for investment purposes) in financial instruments, such as swap agreements, and securities of the index, ETFs that track the index and other financial instruments that provide daily leveraged exposure to the index or ETFs that track the index. The index attempts to measure the performance of the aerospace and defense industry of the U.S. equity market. The fund is non-diversified.
General
Security Type Exchange-Traded Fund
Equity Style Large Cap/Blend
Fixed Income Style --
Broad Asset Class Miscellaneous
Broad Category Miscellaneous
Category Name Trading--Leveraged Equity
Category Index S&P 500 TR USD
Global Category Name Trading Tools
YCharts Categorization Other
YCharts Benchmark S&P 500 Total Return (^SPXTR)
Prospectus Objective Specialty - Unaligned
Fund Owner Firm Name Direxion Funds
Prospectus Benchmark Index
DJ US Select Aerospace&Defense TR USD 300.0%
Broad Asset Class Benchmark Index
^SPXTR 100.0%
Manager Tenure
Paul Brigandi 5.83 yrs
Tony Ng 5.83 yrs

Fundamentals

General
Distribution Yield Upgrade
Dividend Yield TTM (3-31-23) 0.65%
30-Day SEC Yield --
7-Day SEC Yield --
Number of Holdings Upgrade
Stock
Weighted Average PE Ratio 26.51
Weighted Average Price to Sales Ratio Upgrade
Weighted Average Price to Book Ratio Upgrade
Weighted Median ROE Upgrade
Weighted Median ROA Upgrade
Forecasted Dividend Yield Upgrade
Forecasted PE Ratio Upgrade
Forecasted Price to Sales Ratio Upgrade
Forecasted Price to Book Ratio Upgrade
As of March 29, 2023

Growth Estimates

Forecasted 5 Yr Earnings Growth Upgrade
Forecasted Book Value Growth Upgrade
Forecasted Cash Flow Growth Upgrade
Forecasted Earnings Growth Upgrade
Forecasted Revenue Growth Upgrade
As of March 29, 2023

Fund Details

Key Dates
Inception Date 5/3/2017
Last Annual Report Date 10/31/2022
Last Prospectus Date 2/28/2023
Attributes
Index Fund Yes
Inverse Fund No
Leveraged Fund Yes
Fund of Funds No
Currency Hedged Fund No
Synthetic Replication Fund No
Has Dividend Investment Plan No
Socially Responsible Fund No

Top Portfolio Holders

0 of 0