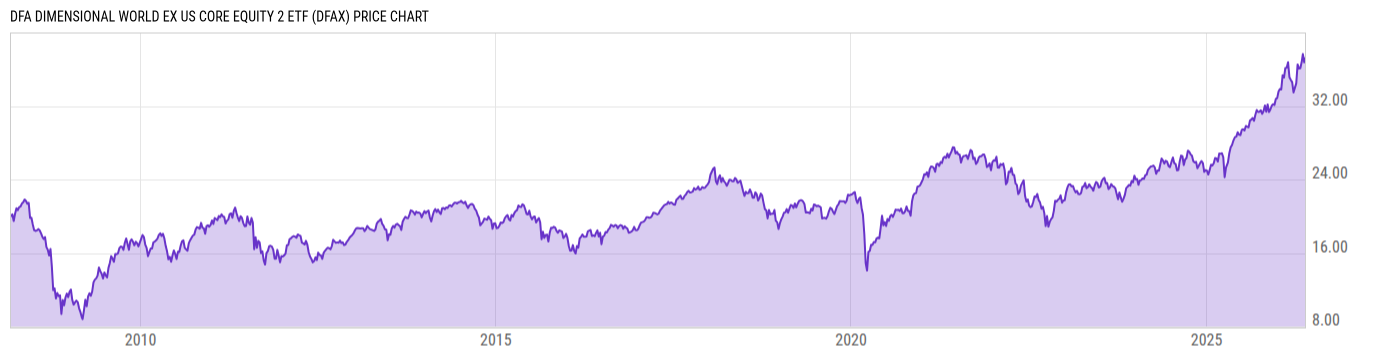
Key Stats

Expense Ratio Discount or Premium to NAV Total Assets Under Management 30-Day Average Daily Volume
0.30% 0.23% 5.331B 556567.2
Dividend Yield Turnover Ratio 1 Year Fund Level Flows Max Drawdown (All)
3.27% 8.00% 968.33M Upgrade

Basic Info

Investment Strategy
The investment seeks to achieve long-term capital appreciation while considering federal tax implications of investment decisions. Generally, the Advisor buys and sells securities for the Portfolio with the goals of: (i) delaying and minimizing the realization of net capital gains (e.g., selling stocks with capital losses to offset gains, realized or anticipated); and (ii) maximizing the extent to which any realized net capital gains are long-term in nature (i.e., taxable at lower capital gains tax rates). The Portfolio is designed to purchase a broad and diverse group of securities of non‑U.S. companies in countries with developed and emerging markets.
General
Security Type Exchange-Traded Fund
Equity Style Large Cap/Value
Fixed Income Style --
Broad Asset Class International Equity
Broad Category Equity
Category Name Foreign Large Blend
Category Index MSCI ACWI Ex USA NR USD
Global Category Name Global Equity Large Cap
YCharts Categorization Global Equity Large Cap
YCharts Benchmark MSCI ACWI Ex USA Total Return (^MSACXUSTR)
Prospectus Objective Diversified Emerging Markets
Fund Owner Firm Name Dimensional Fund Advisors
Prospectus Benchmark Index
MSCI ACWI Ex USA NR USD 100.0%
Broad Asset Class Benchmark Index
^MSACXUSNTR 100.0%
Manager Tenure
Jed Fogdall 13.01 yrs
Allen Pu 7.62 yrs
Mary Phillips 6.01 yrs
William Collins-Dean 3.17 yrs
Joseph Hohn 1.00 yrs

Net Fund Flows Versus Category

View Net Fund Flows. Upgrade now.
1M
3M
6M
YTD
1Y
3Y
5Y
10Y
 
80.00B
60.00B
40.00B
20.00B
0
-20.00B
1 Month
% Rank: --
-- Category Low
-- Category High
1 Year
% Rank: 5
968.33M
-5.497B Category Low
7.452B Category High
3 Months
% Rank: --
-- Category Low
-- Category High
3 Years
% Rank: --
-- Category Low
-- Category High
6 Months
% Rank: --
-- Category Low
-- Category High
5 Years
% Rank: --
-- Category Low
-- Category High
YTD
% Rank: --
-- Category Low
-- Category High
10 Years
% Rank: --
-- Category Low
-- Category High
As of February 28, 2023

Performance Versus Category

 
20%
15%
10%
5%
0
View Category Returns. Upgrade now.
Name
1M
3M
YTD
1Y
3Y
5Y
10Y
15Y
Total Return (Price)
--
--
--
--
--
--
--
--
Total Return (NAV)
--
--
--
--
--
--
--
--
Category Rtn. (NAV)
--
--
--
--
--
--
--
--
% Rank in Cat (NAV)
--
--
--
--
--
--
--
--
As of March 28, 2023. Returns for periods of 1 year and above are annualized.

Annual Total Returns Versus Peers

Loading chart...
Name
2016
2017
2018
2019
2020
2021
2022
YTD
6.16%
30.50%
-16.87%
19.84%
9.11%
11.73%
-14.42%
4.50%
4.50%
27.19%
-14.20%
21.51%
10.65%
7.82%
-16.00%
4.24%
2.67%
26.42%
-14.75%
22.62%
9.74%
11.67%
-15.36%
5.01%
4.91%
27.39%
-14.19%
21.83%
11.12%
8.28%
-15.59%
4.44%
4.54%
27.22%
-13.94%
21.03%
10.29%
7.68%
-16.04%
4.66%
4.84%
26.87%
-13.82%
21.90%
9.81%
8.82%
-15.37%
4.53%
As of March 28, 2023.

Fundamentals

General
Distribution Yield Upgrade
Dividend Yield TTM (3-28-23) 3.27%
30-Day SEC Yield --
7-Day SEC Yield --
Number of Holdings Upgrade
Stock
Weighted Average PE Ratio 10.44
Weighted Average Price to Sales Ratio Upgrade
Weighted Average Price to Book Ratio Upgrade
Weighted Median ROE Upgrade
Weighted Median ROA Upgrade
Forecasted Dividend Yield Upgrade
Forecasted PE Ratio Upgrade
Forecasted Price to Sales Ratio Upgrade
Forecasted Price to Book Ratio Upgrade
As of March 27, 2023

Growth Estimates

Forecasted 5 Yr Earnings Growth Upgrade
Forecasted Book Value Growth Upgrade
Forecasted Cash Flow Growth Upgrade
Forecasted Earnings Growth Upgrade
Forecasted Revenue Growth Upgrade
As of March 27, 2023

Asset Allocation

As of March 27, 2023.
Type % Net % Long % Short
Cash 0.00% Upgrade Upgrade
Stock 99.97% Upgrade Upgrade
Bond 0.00% Upgrade Upgrade
Convertible 0.00% Upgrade Upgrade
Preferred 0.02% Upgrade Upgrade
Other 0.02% Upgrade Upgrade

Top 10 Holdings

Name % Weight Price % Change
Nestle SA 0.75% 119.95 0.34%
Samsung Electronics Co Ltd 0.67% 40.60 0.00%
TotalEnergies SE 0.55% 58.41 3.78%
Shell PLC ADR (Representing - Ordinary Shares) 0.55% 56.17 0.59%
Tencent Holdings Ltd 0.55% 49.75 7.85%
LVMH Moet Hennessy Louis Vuitton SE 0.52% 880.82 -1.03%
Novo Nordisk A/S Class B 0.51% 154.58 0.06%
Taiwan Semiconductor Manufacturing Co Ltd ADR 0.50% 90.81 0.17%
Novartis AG ADR 0.48% 90.95 0.74%
ASML Holding NV ADR 0.42% 639.71 -0.67%

News

Headline
Wire
Time (ET)
No Data Available

Basic Info

Investment Strategy
The investment seeks to achieve long-term capital appreciation while considering federal tax implications of investment decisions. Generally, the Advisor buys and sells securities for the Portfolio with the goals of: (i) delaying and minimizing the realization of net capital gains (e.g., selling stocks with capital losses to offset gains, realized or anticipated); and (ii) maximizing the extent to which any realized net capital gains are long-term in nature (i.e., taxable at lower capital gains tax rates). The Portfolio is designed to purchase a broad and diverse group of securities of non‑U.S. companies in countries with developed and emerging markets.
General
Security Type Exchange-Traded Fund
Equity Style Large Cap/Value
Fixed Income Style --
Broad Asset Class International Equity
Broad Category Equity
Category Name Foreign Large Blend
Category Index MSCI ACWI Ex USA NR USD
Global Category Name Global Equity Large Cap
YCharts Categorization Global Equity Large Cap
YCharts Benchmark MSCI ACWI Ex USA Total Return (^MSACXUSTR)
Prospectus Objective Diversified Emerging Markets
Fund Owner Firm Name Dimensional Fund Advisors
Prospectus Benchmark Index
MSCI ACWI Ex USA NR USD 100.0%
Broad Asset Class Benchmark Index
^MSACXUSNTR 100.0%
Manager Tenure
Jed Fogdall 13.01 yrs
Allen Pu 7.62 yrs
Mary Phillips 6.01 yrs
William Collins-Dean 3.17 yrs
Joseph Hohn 1.00 yrs

Fundamentals

General
Distribution Yield Upgrade
Dividend Yield TTM (3-28-23) 3.27%
30-Day SEC Yield --
7-Day SEC Yield --
Number of Holdings Upgrade
Stock
Weighted Average PE Ratio 10.44
Weighted Average Price to Sales Ratio Upgrade
Weighted Average Price to Book Ratio Upgrade
Weighted Median ROE Upgrade
Weighted Median ROA Upgrade
Forecasted Dividend Yield Upgrade
Forecasted PE Ratio Upgrade
Forecasted Price to Sales Ratio Upgrade
Forecasted Price to Book Ratio Upgrade
As of March 27, 2023

Growth Estimates

Forecasted 5 Yr Earnings Growth Upgrade
Forecasted Book Value Growth Upgrade
Forecasted Cash Flow Growth Upgrade
Forecasted Earnings Growth Upgrade
Forecasted Revenue Growth Upgrade
As of March 27, 2023

Fund Details

Key Dates
Inception Date 3/3/2008
Last Annual Report Date 10/31/2022
Last Prospectus Date 2/28/2023
Attributes
Index Fund No
Inverse Fund No
Leveraged Fund No
Fund of Funds No
Currency Hedged Fund No
Synthetic Replication Fund No
Has Dividend Investment Plan No
Socially Responsible Fund No

News

Headline
Wire
Time (ET)
No Data Available

Top Portfolio Holders

0 of 0