

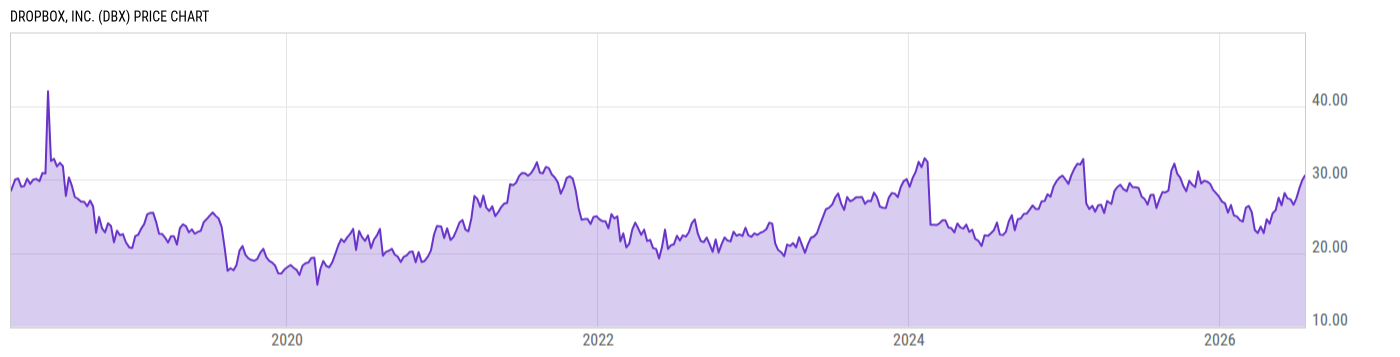
Dropbox, Inc. (DBX)
30.52
-0.10
(-0.34%)
USD |
NASDAQ |
Jul 20, 16:00
30.52
0.00 (0.00%)
After-Hours: 16:01
Price Chart
Key Stats
| Price and Performance | |
|---|---|
| Market Cap | 7.028B |
| 52 Week High (Daily) | |
| 52 Week Low (Daily) | |
| All-Time High (Daily) | |
| Year to Date Total Returns (Daily) | |
| 1 Month Total Returns (Daily) | |
| 1 Year Total Returns (Daily) | 13.70% |
| Valuation | |
| PE Ratio | 16.65 |
| PE Ratio (Forward) | |
| PS Ratio | 3.119 |
| Price to Book Value | -- |
| EV to EBITDA | |
| Dividend | |
|---|---|
| Dividend | -- |
| Dividend Yield (Forward) | |
| Financials | |
| Revenue (5 Year Growth) | |
| Revenue (Quarterly YoY Growth) | |
| EPS Diluted (5 Year Growth) | |
| EPS Diluted (Quarterly YoY Growth) | |
| Debt to Equity Ratio | -1.993 |
| Return on Equity | |
| Return on Assets | |
| Risk | |
| Beta (5Y) | |
| Max Drawdown (5Y) | 54.83% |
Profile
| Dropbox, Inc. engages in providing file backup, sync, and sharing solutions. Its products include Dropbox, Dropbox Reply, Dropbox Sign, Dropbox Reclaim.ai, Dropbox Dash, Dropbox DocSend, Dropbox Fax, and Dropbox Early access. It operates through the United States and International geographical segments. The company was founded by Andrew W. Houston and Arash Ferdowsi in May 2007 and is headquartered in San Francisco, CA. |
| URL | http://www.dropbox.com |
| Investor Relations URL | https://investors.dropbox.com/ |
| HQ State/Province | California |
| Sector | Information Technology |
| Industry | Software |
| Equity Style | Small Cap Core |
| Next Earnings Release | Aug. 06, 2026 |
| Last Earnings Release | May. 07, 2026 |
| Next Ex-Dividend Date | N/A |
| Last Ex-Dividend Date | N/A |