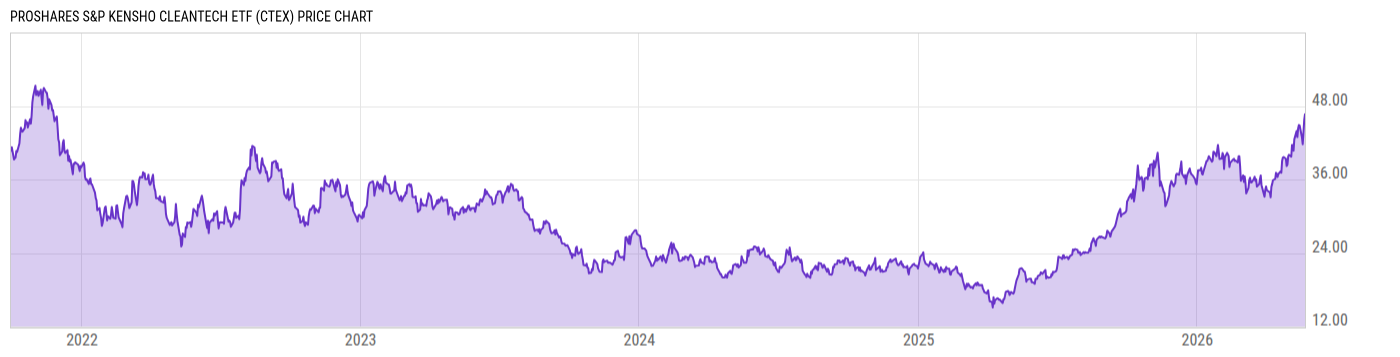
Key Stats

Expense Ratio Discount or Premium to NAV Total Assets Under Management 30-Day Average Daily Volume
0.58% 0.08% 6.555M 2272.43
Dividend Yield Turnover Ratio 1 Year Fund Level Flows Max Drawdown (All)
0.00% 40.00% 4.631M Upgrade

Basic Info

Investment Strategy
The investment seeks results, before fees and expenses, that track the performance of the S&P Kensho Cleantech Index (the “index”). The fund invests in financial instruments that ProShare Advisors believes, in combination, should track the performance of the index. The index selects companies focused on building the technologies or products that enable the generation of clean energy, such as solar, wind, geothermal, hydrogen, and hydroelectric. The fund will invest in all of the component securities of the index in approximately the same proportion as the index. It is non-diversified.
General
Security Type Exchange-Traded Fund
Equity Style Mid Cap/Growth
Fixed Income Style --
Broad Asset Class Sector Equity
Broad Category Equity
Category Name Technology
Category Index Morningstar US Tech TR USD
Global Category Name Technology Sector Equity
YCharts Categorization Technology Equity
YCharts Benchmark S&P 1500 Information Technology (Sector) Total Return (^SP15IFTSTR)
Prospectus Objective Specialty - Unaligned
Fund Owner Firm Name ProShares
Prospectus Benchmark Index
S&P Kensho Cleantech USD 100.0%
Broad Asset Class Benchmark Index
^MSWNTR 100.0%
Manager Tenure
Alexander Ilyasov 1.42 yrs
Eric Silverthorne 0.00 yrs

Net Fund Flows Versus Category

View Net Fund Flows. Upgrade now.
1M
3M
6M
YTD
1Y
3Y
5Y
10Y
 
80.00B
60.00B
40.00B
20.00B
0
-20.00B
1 Month
% Rank: --
-- Category Low
-- Category High
1 Year
% Rank: 11
4.631M
-1.996B Category Low
1.840B Category High
3 Months
% Rank: --
-- Category Low
-- Category High
3 Years
% Rank: --
-- Category Low
-- Category High
6 Months
% Rank: --
-- Category Low
-- Category High
5 Years
% Rank: --
-- Category Low
-- Category High
YTD
% Rank: --
-- Category Low
-- Category High
10 Years
% Rank: --
-- Category Low
-- Category High
As of February 28, 2023

Performance Versus Category

 
20%
15%
10%
5%
0
View Category Returns. Upgrade now.
Name
1M
3M
YTD
1Y
3Y
5Y
10Y
15Y
Total Return (Price)
--
--
--
--
--
--
--
--
Total Return (NAV)
--
--
--
--
--
--
--
--
Category Rtn. (NAV)
--
--
--
--
--
--
--
--
% Rank in Cat (NAV)
--
--
--
--
--
--
--
--
As of March 23, 2023. Returns for periods of 1 year and above are annualized.

Annual Total Returns Versus Peers

Loading chart...
Name
2016
2017
2018
2019
2020
2021
2022
YTD
--
--
--
--
--
--
-20.38%
6.03%
7.51%
22.40%
-8.71%
27.67%
15.90%
21.82%
-18.14%
3.98%
--
--
--
--
--
--
--
5.65%
--
--
--
--
70.83%
13.23%
-33.67%
8.48%
--
--
--
--
91.00%
-8.38%
-33.42%
5.17%
--
--
--
--
--
--
-44.33%
6.33%
As of March 23, 2023.

Fundamentals

General
Distribution Yield Upgrade
Dividend Yield TTM (3-23-23) 0.00%
30-Day SEC Yield --
7-Day SEC Yield --
Number of Holdings Upgrade
Stock
Weighted Average PE Ratio 24.49
Weighted Average Price to Sales Ratio Upgrade
Weighted Average Price to Book Ratio Upgrade
Weighted Median ROE Upgrade
Weighted Median ROA Upgrade
Forecasted Dividend Yield Upgrade
Forecasted PE Ratio Upgrade
Forecasted Price to Sales Ratio Upgrade
Forecasted Price to Book Ratio Upgrade
As of July 31, 2022

Growth Estimates

Forecasted 5 Yr Earnings Growth Upgrade
Forecasted Book Value Growth Upgrade
Forecasted Cash Flow Growth Upgrade
Forecasted Earnings Growth Upgrade
Forecasted Revenue Growth Upgrade
As of July 31, 2022

Asset Allocation

As of July 31, 2022.
Type % Net % Long % Short
Cash 0.00% Upgrade Upgrade
Stock 100.0% Upgrade Upgrade
Bond 0.00% Upgrade Upgrade
Convertible 0.00% Upgrade Upgrade
Preferred 0.00% Upgrade Upgrade
Other -0.03% Upgrade Upgrade

Top 10 Holdings

Name % Weight Price % Change
Array Technologies Inc Ordinary Shares
5.18% -- --
Enphase Energy Inc 4.76% 196.14 -4.16%
Shoals Technologies Group Inc Ordinary Shares - Class A 4.38% 21.34 -0.30%
Sunnova Energy International Inc 4.15% 13.16 -0.49%
First Solar Inc 4.13% 211.09 0.43%
SolarEdge Technologies Inc 3.96% 284.55 -2.40%
Daqo New Energy Corp ADR 3.90% 50.66 3.35%
Maxeon Solar Technologies Ltd Ordinary Shares 3.90% 24.79 0.90%
ReneSola Ltd ADR 3.89% 4.075 -1.33%
Sunrun Inc 3.88% 17.94 1.73%

Basic Info

Investment Strategy
The investment seeks results, before fees and expenses, that track the performance of the S&P Kensho Cleantech Index (the “index”). The fund invests in financial instruments that ProShare Advisors believes, in combination, should track the performance of the index. The index selects companies focused on building the technologies or products that enable the generation of clean energy, such as solar, wind, geothermal, hydrogen, and hydroelectric. The fund will invest in all of the component securities of the index in approximately the same proportion as the index. It is non-diversified.
General
Security Type Exchange-Traded Fund
Equity Style Mid Cap/Growth
Fixed Income Style --
Broad Asset Class Sector Equity
Broad Category Equity
Category Name Technology
Category Index Morningstar US Tech TR USD
Global Category Name Technology Sector Equity
YCharts Categorization Technology Equity
YCharts Benchmark S&P 1500 Information Technology (Sector) Total Return (^SP15IFTSTR)
Prospectus Objective Specialty - Unaligned
Fund Owner Firm Name ProShares
Prospectus Benchmark Index
S&P Kensho Cleantech USD 100.0%
Broad Asset Class Benchmark Index
^MSWNTR 100.0%
Manager Tenure
Alexander Ilyasov 1.42 yrs
Eric Silverthorne 0.00 yrs

Fundamentals

General
Distribution Yield Upgrade
Dividend Yield TTM (3-23-23) 0.00%
30-Day SEC Yield --
7-Day SEC Yield --
Number of Holdings Upgrade
Stock
Weighted Average PE Ratio 24.49
Weighted Average Price to Sales Ratio Upgrade
Weighted Average Price to Book Ratio Upgrade
Weighted Median ROE Upgrade
Weighted Median ROA Upgrade
Forecasted Dividend Yield Upgrade
Forecasted PE Ratio Upgrade
Forecasted Price to Sales Ratio Upgrade
Forecasted Price to Book Ratio Upgrade
As of July 31, 2022

Growth Estimates

Forecasted 5 Yr Earnings Growth Upgrade
Forecasted Book Value Growth Upgrade
Forecasted Cash Flow Growth Upgrade
Forecasted Earnings Growth Upgrade
Forecasted Revenue Growth Upgrade
As of July 31, 2022

Fund Details

Key Dates
Inception Date 9/29/2021
Last Annual Report Date 5/31/2022
Last Prospectus Date 10/1/2022
Attributes
Index Fund Yes
Inverse Fund No
Leveraged Fund No
Fund of Funds No
Currency Hedged Fund No
Synthetic Replication Fund No
Has Dividend Investment Plan No
Socially Responsible Fund Yes

Top Portfolio Holders

0 of 0