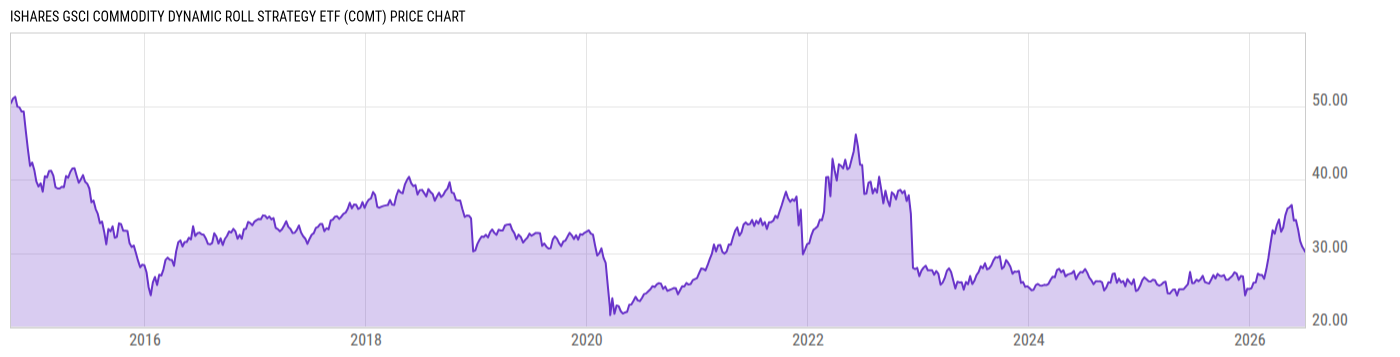
iShares Commodities Select Strategy ETF (COMT)
32.44
+0.26 +0.81%
NASDAQ
Dec 6, 13:19
Delayed 2m
USD
Key Stats
Expense Ratio | 0.48% |
Total Assets Under Management | 515.09M |
Share Class Assets Under Management | 515.09M |
30-Day Average Daily Volume | 251743.7 |
Net Asset Value | 32.19 |
Discount or Premium to NAV | -0.03% |
Turnover Ratio | 167.0% |
1 Year Fund Level Flows | -48.95M |
View All COMT News
News
-
WireHeadlineTime (ET)
-
SA Breaking News11/02 11:37
-
Business Wire02/02 08:05
-
SA Breaking News12/26 12:08
-
SA Breaking News11/09 09:45
-
SA Breaking News11/09 03:06
-
SA Breaking News07/11 09:15
-
SA Breaking News10/21 11:14
-
SA Breaking News08/31 12:30
-
SA Breaking News07/31 08:13
-
SA Breaking News07/20 08:02
Performance & Returns
Total Return (Price) | Total Return (NAV) | Cat. Total Return (NAV) | % Rank in Cat. (NAV) | |
---|---|---|---|---|
1M | -1.71% | -1.74% | -2.53% | 24 |
3M | 2.55% | 2.61% | 0.33% | 15 |
6M | 3.84% | 3.54% | 1.43% | 29 |
YTD | 5.54% | 5.61% | 3.78% | 30 |
1Y | -0.07% | -0.48% | -2.36% | 27 |
3Y | 3.39% | 3.22% | -1.36% | 4 |
5Y | -3.40% | -3.40% | -5.48% | 15 |
10Y | -- | -- | -5.31% | -- |
15Y | -- | -- | -2.04% | -- |
20Y | -- | -- | -- | -- |
Asset Allocation
Type | % Net | % Long | % Short |
---|---|---|---|
Cash | 58.02% | 62.33% | 4.31% |
Stock | 30.02% | 30.02% | 0.00% |
Bond | 9.55% | 9.55% | 0.00% |
Convertible | 2.40% | 2.40% | 0.00% |
Preferred | 0.00% | 0.00% | 0.00% |
Other | 0.00% | 0.00% | 0.00% |
Region Exposure
Americas | 77.48% |
North America | 74.75% |
Latin America | 2.73% |
Greater Europe | 15.12% |
United Kingdom | 12.12% |
Europe Developed | 2.85% |
Europe Emerging | 0.12% |
Africa/Middle East | 0.03% |
Greater Asia | 7.40% |
Japan | 1.39% |
Australasia | 2.74% |
Asia Developed | 2.72% |
Asia Emerging | 0.55% |
Market Classification | |
% Developed Markets | 96.58% |
% Emerging Markets | 3.42% |
Stock Sector Exposure
Basic Materials | 48.66% |
Communication Services | 0.00% |
Consumer Cyclical | 0.00% |
Consumer Defensive | 3.02% |
Energy | 42.38% |
Financial Services | 0.00% |
Healthcare | 0.00% |
Industrials | 5.93% |
Real Estate | 0.00% |
Technology | 0.00% |
Utilities | 0.00% |
Stock Market Capitalization
Giant | 37.89% |
Large | 36.24% |
Medium | 21.06% |
Small | 4.81% |
Micro | 0.00% |
Stock Style Exposure
Large Cap Value | 37.48% |
Large Cap Blend | 26.91% |
Large Cap Growth | 9.98% |
Mid Cap Value | 7.45% |
Mid Cap Blend | 10.42% |
Mid Cap Growth | 3.03% |
Small Cap Value | 1.16% |
Small Cap Blend | 2.28% |
Small Cap Growth | 1.28% |
COMT Bond Exposure
Government | 1.97% |
Corporate | 14.12% |
Securitized | 0.00% |
Municipal | 0.00% |
Cash | 83.91% |
Derivative | 0.00% |
COMT Bond Credit Quality Exposure
AAA | -- |
AA | -- |
A | -- |
BBB | -- |
BB | -- |
B | -- |
Below B | -- |
COMT Bond Maturity Exposure
1 to 7 Days | 0.00% |
8 to 30 Days | 0.00% |
31 to 90 Days | 0.00% |
91 to 182 Days | 21.62% |
183 to 364 Days | 0.00% |
1 to 3 Years | 9.81% |
3 to 5 Years | 31.82% |
5 to 7 Years | 0.00% |
7 to 10 Years | 11.45% |
10 to 15 Years | 4.09% |
15 to 20 Years | 0.00% |
20 to 30 Years | 21.21% |
Over 30 Years | 0.00% |
View More Holdings
As of Dec. 2, 2019
Top 10 Holdings
Symbol | Name | % Weight | Price | % Chg |
---|---|---|---|---|
-- | Natl Sec Clearing Corp | 2.05% | -- | -- |
ASSF | United States Treasury Bills 0% | 1.98% | -- | -- |
ASSF | Walgreens Boots Alliance, Inc. 0% | 1.95% | -- | -- |
ASSF | United States Treasury Bills 0% | 1.86% | -- | -- |
XOM | Exxon Mobil Corp | 1.78% | 69.66 | +1.83% |
ASSF | American Electric Power Co, Inc. 0% | 1.47% | -- | -- |
ASSF | AT&T Inc 0% | 1.37% | -- | -- |
ASSF | NUTRIEN LTD 0% | 1.37% | -- | -- |
CVX | Chevron Corp | 1.36% | 118.66 | +2.00% |
ASSF | Lloyds Bank plc 0% | 1.36% | -- | -- |
Advertisement
Basic Info
Investment Strategy | |
---|---|
The investment seeks total return by providing investors with broad commodity exposure. The fund seeks to achieve its investment objective by investing in a combination of exchange-traded commodity futures contracts, exchange-traded options on commodity-related futures contracts and exchange-cleared commodity-related swaps (together, "Commodity-Linked Investments") and equity securities of issuers engaged in a commodities-related business ("Commodity-Related Equities"), thereby obtaining exposure to the commodities markets. It is an actively managed exchange-traded fund ("ETF") that does not seek to replicate the performance of a specified index. | |
General | |
Security Type | Exchange-Traded Fund |
Equity Style | Large Cap/Value |
Fixed Income Style | -- |
Broad Asset Class | Commodities |
Broad Category | Commodities |
Category Name | Commodities Broad Basket |
Prospectus Objective | Growth and Income |
Fund Owner Firm Name | iShares |
Reports | |
One Page Report | Download |
Manager Info
Name | Tenure |
---|---|
Alan Mason | 3.21 yrs |
Amy Whitelaw | 0.50 yrs |
Greg Savage | 4.71 yrs |
Richard Mejzak | 2.68 yrs |
Robert Shimell | 4.71 yrs |
Net Fund Flows
1M | -3.276M |
3M | 94.74M |
6M | 179.69M |
YTD | 100.17M |
1Y | -48.95M |
3Y | 381.61M |
5Y | 604.07M |
10Y | -- |
Risk Info
Beta (5Y) | 1.250 |
Max Drawdown (All) | 51.88% |
Historical Sharpe Ratio (10Y) | -- |
Historical Sortino (All) | -0.5349 |
30-Day Rolling Volatility | 10.48% |
Daily Value at Risk (VaR) 1% (All) | 2.67% |
Monthly Value at Risk (VaR) 1% (All) | 12.96% |
Fundamentals
General | |
---|---|
Dividend Yield TTM (12-6-19) | 10.95% |
30-Day SEC Yield (12-18-18) | 0.00% |
7-Day SEC Yield | -- |
Forecasted Dividend Yield | 3.63% |
Number of Holdings | 242 |
Stock | |
Weighted Average PE Ratio | 16.03 |
Weighted Average Price to Sales Ratio | 1.043 |
Weighted Average Price to Book Ratio | 1.648 |
Weighted Median ROE | 12.96% |
Weighted Median ROA | 4.95% |
Forecasted PE Ratio | 16.48 |
Forecasted PS Ratio | 0.9481 |
Forecasted Price to Book Value | 1.484 |
Number of Stock Holdings | 162 |
Bond | |
Current Yield | 5.02% |
Yield to Maturity | 3.36% |
Effective Duration | -- |
Average Coupon | 6.57% |
Average Credit Score | -- |
Average Price | -- |
Number of Bond Holdings | 4 |
Attributes
Key Dates | |
---|---|
Inception Date | 10/15/2014 |
Termination Date | |
Last Annual Report Date | 10/31/2018 |
Last Prospectus Date | 6/21/2019 |
Attributes | |
Exchange Traded Share | Yes |
Exchange Traded Note | No |
Enhanced Index Fund | No |
Fixed Distribution Fund | No |
High-Net Worth Individual Fund | No |
Index Fund | No |
Inverse Fund | No |
Leveraged Fund | No |
Fund of Funds | No |
Currency Hedged Fund | No |
Synthetic Replication Fund | No |
Has Dividend Investment Plan | No |
Socially Responsible Fund | No |
General Availability | |
Available for Insurance Product | No |
Available for Retirement Plan | No |
Available for RRSP | No |
Advertisement