

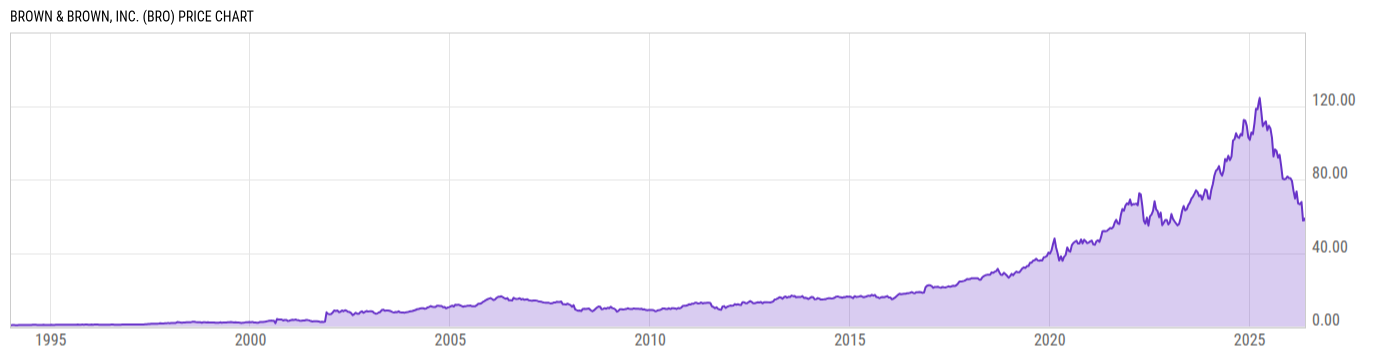
Brown & Brown, Inc. (BRO)
59.09
+1.09
(+1.88%)
USD |
NYSE |
Jun 09, 16:00
59.09
0.00 (0.00%)
After-Hours: 20:00
Price Chart
Key Stats
| Price and Performance | |
|---|---|
| Market Cap | 19.80B |
| 52 Week High (Daily) | |
| 52 Week Low (Daily) | |
| All-Time High (Daily) | |
| Year to Date Total Returns (Daily) | |
| 1 Month Total Returns (Daily) | |
| 1 Year Total Returns (Daily) | -47.08% |
| Valuation | |
| PE Ratio | 19.03 |
| PE Ratio (Forward) | |
| PS Ratio | 3.003 |
| Price to Book Value | 1.572 |
| EV to EBITDA | |
| Dividend | |
|---|---|
| Dividend | 0.165 |
| Dividend Yield (Forward) | |
| Financials | |
| Revenue (5 Year Growth) | |
| Revenue (Quarterly YoY Growth) | |
| EPS Diluted (5 Year Growth) | |
| EPS Diluted (Quarterly YoY Growth) | |
| Debt to Equity Ratio | 0.6449 |
| Return on Equity | |
| Return on Assets | |
| Risk | |
| Beta (5Y) | |
| Max Drawdown (5Y) | 55.85% |
Profile
| Brown & Brown, Inc. is an insurance agency, wholesale brokerage, insurance program and service organization. It engages in the provision of insurance brokerage services and casualty insurance underwriting services. It operates through the following segments: Retail, Specialty Distribution, and Other. The Retail segment offers insurance products and services to commercial, public and quasi-public entities, and to professional and individual customers. The Specialty Distribution segment consists of programs, wholesale brokerage, and specialty businesses. The company was founded by J. Adrian Brown and Charles Covington Owen in 1939 and is headquartered in Daytona Beach, FL. |
| URL | http://www.bbrown.com |
| Investor Relations URL | https://investor.bbrown.com/ |
| HQ State/Province | Florida |
| Sector | Financials |
| Industry | Insurance |
| Next Earnings Release | Jul. 27, 2026 (est.) |
| Last Earnings Release | Apr. 27, 2026 |
| Next Ex-Dividend Date | N/A |
| Last Ex-Dividend Date | May. 11, 2026 |