

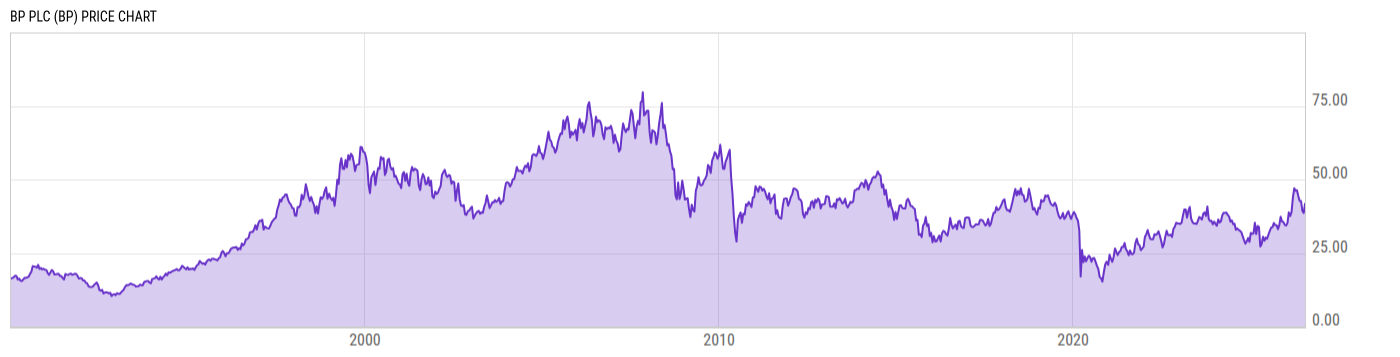
BP Plc (BP)
42.02
+0.12
(+0.29%)
USD |
NYSE |
Jul 20, 16:00
42.02
0.00 (0.00%)
After-Hours: 20:00
Price Chart
Key Stats
| Price and Performance | |
|---|---|
| Market Cap | 108.53B |
| 52 Week High (Daily) | |
| 52 Week Low (Daily) | |
| All-Time High (Daily) | |
| Year to Date Total Returns (Daily) | |
| 1 Month Total Returns (Daily) | |
| 1 Year Total Returns (Daily) | 37.57% |
| Valuation | |
| PE Ratio | 35.02 |
| PE Ratio (Forward) | |
| PS Ratio | 0.5629 |
| Price to Book Value | 1.939 |
| EV to EBITDA | |
| Dividend | |
|---|---|
| Dividend | 0.4992 |
| Dividend Yield (Forward) | |
| Financials | |
| Revenue (5 Year Growth) | |
| Revenue (Quarterly YoY Growth) | |
| EPS Diluted (5 Year Growth) | |
| EPS Diluted (Quarterly YoY Growth) | |
| Debt to Equity Ratio | 1.326 |
| Return on Equity | |
| Return on Assets | |
| Risk | |
| Beta (5Y) | |
| Max Drawdown (5Y) | 41.46% |
Profile
| BP Plc operates as an integrated oil and gas company providing carbon products and services. It operates through the following segments: Gas and Low Carbon Energy, Oil Production and Operations, and Customers and Products. The Gas and Low Carbon Energy segment includes upstream businesses focused on natural gas production, gas marketing and trading activities, as well as solar, wind, and hydrogen ventures. The Oil Production and Operations segment comprises regions with upstream activities that predominantly produce crude oil. The Customers and Products segment includes customer-focused businesses, including convenience and retail fuels, EV charging, Castrol, aviation, B2B, and midstream, along with refining, oil trading, and bioenergy businesses. The company was founded by William Knox D'Arcy in 1908 and is headquartered in London, the United Kingdom. |
| URL | http://www.bp.com |
| Investor Relations URL | https://www.bp.com/en/global/corporate/investors.html |
| HQ State/Province | Greater London |
| Sector | Energy |
| Industry | Oil, Gas & Consumable Fuels |
| Equity Style | Large Cap Value |
| Next Earnings Release | Aug. 04, 2026 |
| Last Earnings Release | Apr. 28, 2026 |
| Next Ex-Dividend Date | N/A |
| Last Ex-Dividend Date | May. 15, 2026 |