

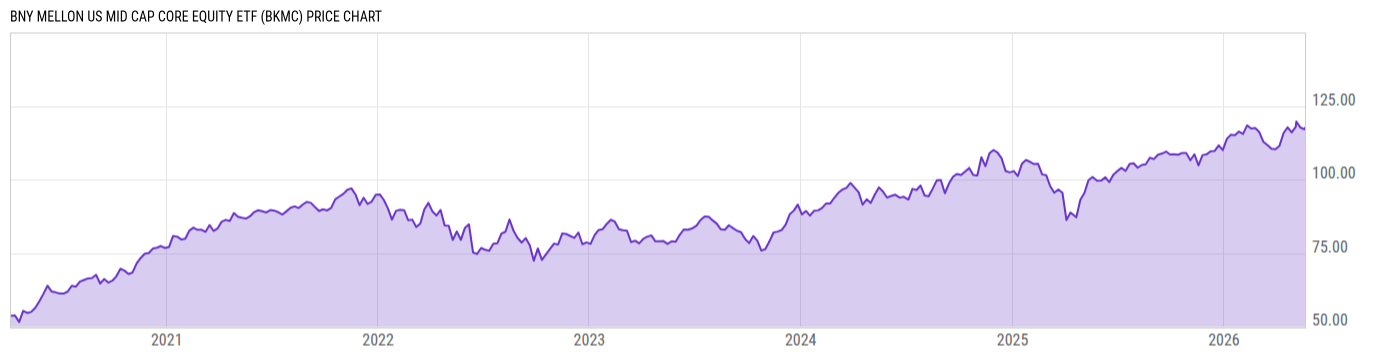
BNY Mellon US Mid Cap Core Equity ETF (BKMC)
117.91
-1.78
(-1.49%)
USD |
NYSEARCA |
Jun 10, 16:00
Price Chart
Key Stats
| Net Expense Ratio | Discount or Premium to NAV | Total Assets Under Management | 30-Day Average Daily Volume |
|---|---|---|---|
| 0.04% | 0.13% | 637.08M | 9321.50 |
| Weighted Average Dividend Yield | Turnover Ratio (Generic) | 1 Year Fund Level Flows | Max Drawdown (Since Inception) |
| 1.36% | 29.00% | 27.44M |
Basic Info
| Investment Strategy | |
| The Fund seeks to track the performance of the Morningstar US Mid Cap Index. The Index is a float-adjusted market capitalization weighted index designed to measure the performance of US medium-capitalization stocks. The Fund normally invests in all of the stocks in the index in proportion to their weighting in the index. |
| General | |
| Security Type | Exchange-Traded Fund |
| Equity Style | Small Cap Core |
| Broad Asset Class | US Equity |
| Broad Category | Equity |
| Global Peer Group | Equity US Sm&Mid Cap |
| Peer Group | Small-Cap Core Funds |
| Global Macro | Equity North America |
| US Macro | Small-Cap Funds |
| YCharts Categorization | -- |
| YCharts Benchmark | -- |
| Prospectus Objective | Small-Cap Funds |
| Fund Owner Firm Name | BNY Investments |
| Broad Asset Class Benchmark Index | |
| ^SPXTR | 100.0% |
Performance Versus Peer Group
Annual Total Returns Versus Peers
As of June 11, 2026.
Asset Allocation
As of May 31, 2026.
| Type | % Net |
|---|---|
| Cash | 0.09% |
| Stock | 99.56% |
| Bond | 0.11% |
| Convertible | 0.00% |
| Preferred | 0.00% |
| Other | 0.24% |
Basic Info
| Investment Strategy | |
| The Fund seeks to track the performance of the Morningstar US Mid Cap Index. The Index is a float-adjusted market capitalization weighted index designed to measure the performance of US medium-capitalization stocks. The Fund normally invests in all of the stocks in the index in proportion to their weighting in the index. |
| General | |
| Security Type | Exchange-Traded Fund |
| Equity Style | Small Cap Core |
| Broad Asset Class | US Equity |
| Broad Category | Equity |
| Global Peer Group | Equity US Sm&Mid Cap |
| Peer Group | Small-Cap Core Funds |
| Global Macro | Equity North America |
| US Macro | Small-Cap Funds |
| YCharts Categorization | -- |
| YCharts Benchmark | -- |
| Prospectus Objective | Small-Cap Funds |
| Fund Owner Firm Name | BNY Investments |
| Broad Asset Class Benchmark Index | |
| ^SPXTR | 100.0% |