

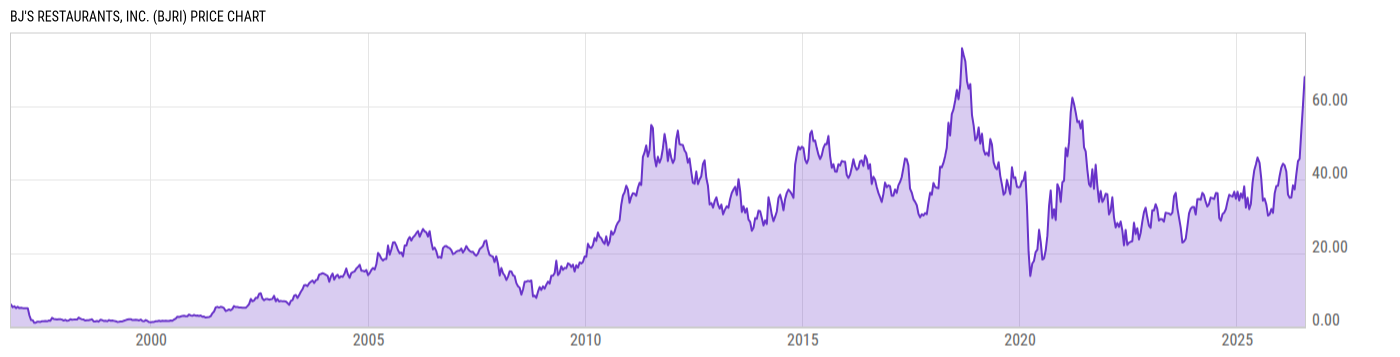
BJ's Restaurants, Inc. (BJRI)
66.81
+1.72
(+2.64%)
USD |
NASDAQ |
Jul 24, 16:00
66.81
0.00 (0.00%)
After-Hours: 18:25
Price Chart
Key Stats
| Price and Performance | |
|---|---|
| Market Cap | 1.406B |
| 52 Week High (Daily) | |
| 52 Week Low (Daily) | |
| All-Time High (Daily) | |
| Year to Date Total Returns (Daily) | |
| 1 Month Total Returns (Daily) | |
| 1 Year Total Returns (Daily) | 59.97% |
| Valuation | |
| PE Ratio | 33.70 |
| PE Ratio (Forward) | |
| PS Ratio | 1.056 |
| Price to Book Value | 3.775 |
| EV to EBITDA | |
| Dividend | |
|---|---|
| Dividend | -- |
| Dividend Yield (Forward) | |
| Financials | |
| Revenue (5 Year Growth) | |
| Revenue (Quarterly YoY Growth) | |
| EPS Diluted (5 Year Growth) | |
| EPS Diluted (Quarterly YoY Growth) | |
| Debt to Equity Ratio | 1.242 |
| Return on Equity | |
| Return on Assets | |
| Risk | |
| Beta (5Y) | |
| Max Drawdown (5Y) | 72.54% |
Profile
| BJ's Restaurants, Inc. engages in the ownership and operation of casual dining restaurants. The firm operates BJ's Restaurant and Brewery, BJ's Restaurant & Brewhouse, and BJ's Pizza and Grill or BJ's Grill. It offers pizzas, appetizers, specialty salads, soups, pastas, sandwiches, entrées, desserts, and proprietary craft beers. The company was founded in 1978 and is headquartered in Huntington Beach, CA. |
| URL | http://www.bjsrestaurants.com |
| Investor Relations URL | https://investors.bjsrestaurants.com |
| HQ State/Province | California |
| Sector | Consumer Discretionary |
| Industry | Hotels, Restaurants & Leisure |
| Equity Style | Small Cap Core |
| Next Earnings Release | Jul. 30, 2026 |
| Last Earnings Release | May. 05, 2026 |
| Next Ex-Dividend Date | N/A |
| Last Ex-Dividend Date | Mar. 09, 2020 |