

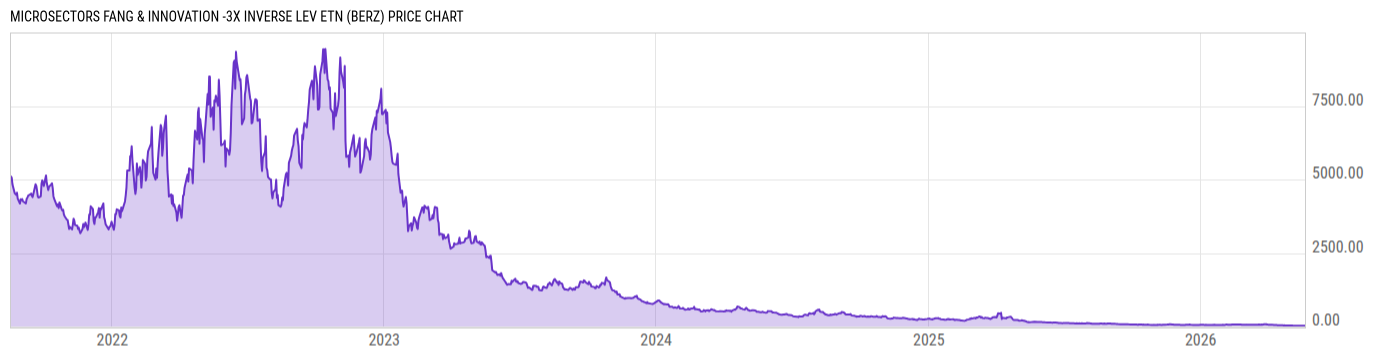
MicroSectors FANG & Innovation -3X Inverse Lev ETN (BERZ)
24.57
+0.10
(+0.41%)
USD |
NYSEARCA |
May 21, 12:57
Price Chart
Key Stats
| Net Expense Ratio | Discount or Premium to NAV | Total Assets Under Management | 30-Day Average Daily Volume |
|---|---|---|---|
| 0.95% | -0.08% | 8.571M | 92811.77 |
| Weighted Average Dividend Yield | Turnover Ratio (Generic) | 1 Year Fund Level Flows | Max Drawdown (Since Inception) |
| -- | -- | 20.57M |
Basic Info
| Investment Strategy | |
| The Fund seeks three times leveraged participation in the daily inverse performance of the Solactive FANG Innovation Index, compounded daily, minus the applicable fees. The Index is a total return index that tracks the stock prices of 15 large capitalization US technology stocks, including eight specific core components. |
| General | |
| Security Type | Exchange-Traded Fund |
| Equity Style | -- |
| Broad Asset Class | Alternative |
| Broad Category | Alternative Strategies |
| Global Peer Group | Alternative Dedicated Short Bias |
| Peer Group | Dedicated Short Bias Funds |
| Global Macro | Liquid Alternatives |
| US Macro | Alternative Equity Funds |
| YCharts Categorization | -- |
| YCharts Benchmark | -- |
| Prospectus Objective | Dedicated Short Bias Funds |
| Fund Owner Firm Name | BMO Global Asset Management |
| Broad Asset Class Benchmark Index | |
| ^MSACWINTR | 100.0% |
Performance Versus Peer Group
Annual Total Returns Versus Peers
As of May 21, 2026.
Asset Allocation
| Type | % Net |
|---|
Basic Info
| Investment Strategy | |
| The Fund seeks three times leveraged participation in the daily inverse performance of the Solactive FANG Innovation Index, compounded daily, minus the applicable fees. The Index is a total return index that tracks the stock prices of 15 large capitalization US technology stocks, including eight specific core components. |
| General | |
| Security Type | Exchange-Traded Fund |
| Equity Style | -- |
| Broad Asset Class | Alternative |
| Broad Category | Alternative Strategies |
| Global Peer Group | Alternative Dedicated Short Bias |
| Peer Group | Dedicated Short Bias Funds |
| Global Macro | Liquid Alternatives |
| US Macro | Alternative Equity Funds |
| YCharts Categorization | -- |
| YCharts Benchmark | -- |
| Prospectus Objective | Dedicated Short Bias Funds |
| Fund Owner Firm Name | BMO Global Asset Management |
| Broad Asset Class Benchmark Index | |
| ^MSACWINTR | 100.0% |