

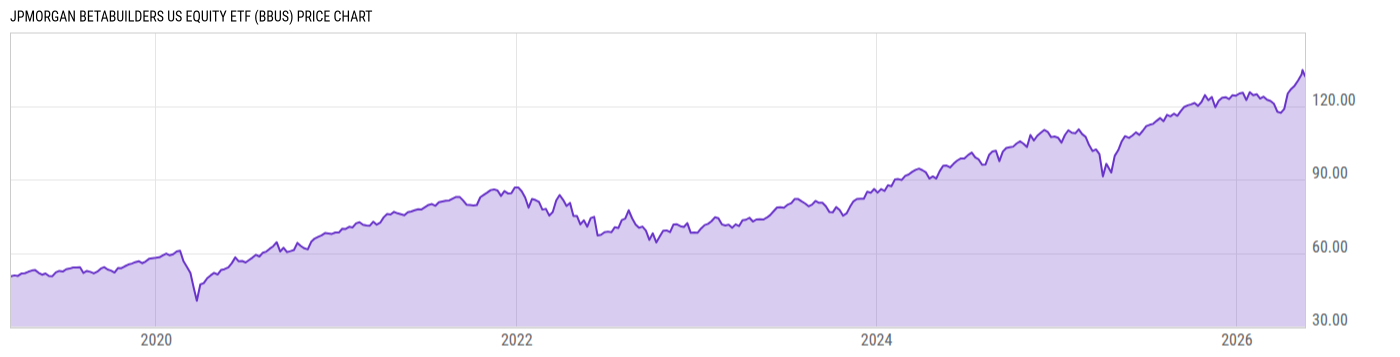
JPMorgan BetaBuilders US Equity ETF (BBUS)
132.95
-0.45
(-0.34%)
USD |
BATS |
Jun 09, 16:00
132.96
+0.02
(+0.01%)
After-Hours: 20:00
Price Chart
Key Stats
| Net Expense Ratio | Discount or Premium to NAV | Total Assets Under Management | 30-Day Average Daily Volume |
|---|---|---|---|
| 0.02% | -0.05% | 8.363B | 255993.7 |
| Weighted Average Dividend Yield | Turnover Ratio (Generic) | 1 Year Fund Level Flows | Max Drawdown (Since Inception) |
| 1.02% | 3.00% | 2.072B |
Basic Info
| Investment Strategy | |
| The Fund seeks investment results that corresponds to the performance of the Morningstar US Target Market Exposure Index. The Index is a free float adjusted market capitalization weighted index which consists of equity securities primarily traded in the US. It primarily includes large- and mid-capitalization companies. |
| General | |
| Security Type | Exchange-Traded Fund |
| Equity Style | Large Cap Core |
| Broad Asset Class | US Equity |
| Broad Category | Equity |
| Global Peer Group | Equity US |
| Peer Group | Large-Cap Core Funds |
| Global Macro | Equity North America |
| US Macro | Large-Cap Funds |
| YCharts Categorization | -- |
| YCharts Benchmark | -- |
| Prospectus Objective | Growth & Income Funds |
| Fund Owner Firm Name | J.P. Morgan Asset Management |
| Broad Asset Class Benchmark Index | |
| ^SPXTR | 100.0% |
Performance Versus Peer Group
Annual Total Returns Versus Peers
As of June 10, 2026.
Asset Allocation
As of May 31, 2026.
| Type | % Net |
|---|---|
| Cash | 0.23% |
| Stock | 99.42% |
| Bond | 0.29% |
| Convertible | 0.00% |
| Preferred | 0.00% |
| Other | 0.06% |
Basic Info
| Investment Strategy | |
| The Fund seeks investment results that corresponds to the performance of the Morningstar US Target Market Exposure Index. The Index is a free float adjusted market capitalization weighted index which consists of equity securities primarily traded in the US. It primarily includes large- and mid-capitalization companies. |
| General | |
| Security Type | Exchange-Traded Fund |
| Equity Style | Large Cap Core |
| Broad Asset Class | US Equity |
| Broad Category | Equity |
| Global Peer Group | Equity US |
| Peer Group | Large-Cap Core Funds |
| Global Macro | Equity North America |
| US Macro | Large-Cap Funds |
| YCharts Categorization | -- |
| YCharts Benchmark | -- |
| Prospectus Objective | Growth & Income Funds |
| Fund Owner Firm Name | J.P. Morgan Asset Management |
| Broad Asset Class Benchmark Index | |
| ^SPXTR | 100.0% |