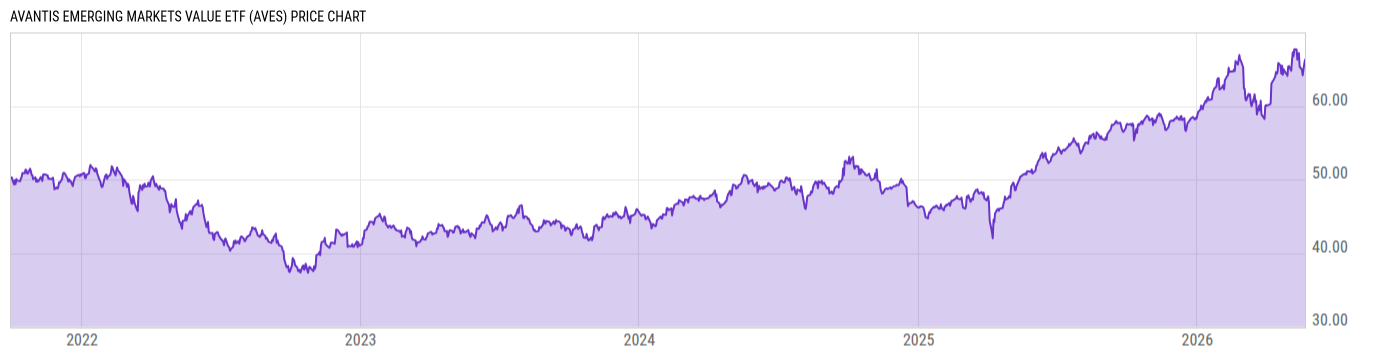
Key Stats

Expense Ratio Discount or Premium to NAV Total Assets Under Management 30-Day Average Daily Volume
0.36% 0.48% 231.57M 30126.50
Dividend Yield Turnover Ratio 1 Year Fund Level Flows Max Drawdown (All)
3.62% 8.00% 159.58M Upgrade

Basic Info

Investment Strategy
The investment seeks long-term capital appreciation. The fund invests primarily in a diverse group of companies related to emerging markets across market sectors, industry groups and countries. The fund may invest in companies of all market capitalizations. Under normal market conditions, the fund will invest at least 80% of its assets in equity securities of companies related to emerging market countries. The adviser generally intends to focus its investments in a subset of the emerging markets countries that comprise the MSCI Emerging Markets Value IMI Index.
General
Security Type Exchange-Traded Fund
Equity Style Large Cap/Value
Fixed Income Style --
Broad Asset Class International Equity
Broad Category Equity
Category Name Diversified Emerging Mkts
Category Index MSCI EM NR USD
Global Category Name Global Emerging Markets Equity
YCharts Categorization Emerging Markets
YCharts Benchmark MSCI Emerging Markets Total Return (^MSEMTR)
Prospectus Objective Diversified Emerging Markets
Fund Owner Firm Name Avantis Investors
Prospectus Benchmark Index
MSCI EM IMI Value NR USD 100.0%
Broad Asset Class Benchmark Index
^MSACXUSNTR 100.0%
Manager Tenure
Daniel Ong 1.42 yrs
Eduardo Repetto 1.42 yrs
Mitchell Firestein 1.42 yrs
Ted Randall 1.42 yrs

Net Fund Flows Versus Category

View Net Fund Flows. Upgrade now.
1M
3M
6M
YTD
1Y
3Y
5Y
10Y
 
80.00B
60.00B
40.00B
20.00B
0
-20.00B
1 Month
% Rank: --
-- Category Low
-- Category High
1 Year
% Rank: 11
159.58M
-10.02B Category Low
7.629B Category High
3 Months
% Rank: --
-- Category Low
-- Category High
3 Years
% Rank: --
-- Category Low
-- Category High
6 Months
% Rank: --
-- Category Low
-- Category High
5 Years
% Rank: --
-- Category Low
-- Category High
YTD
% Rank: --
-- Category Low
-- Category High
10 Years
% Rank: --
-- Category Low
-- Category High
As of February 28, 2023

Performance Versus Category

 
20%
15%
10%
5%
0
View Category Returns. Upgrade now.
Name
1M
3M
YTD
1Y
3Y
5Y
10Y
15Y
Total Return (Price)
--
--
--
--
--
--
--
--
Total Return (NAV)
--
--
--
--
--
--
--
--
Category Rtn. (NAV)
--
--
--
--
--
--
--
--
% Rank in Cat (NAV)
--
--
--
--
--
--
--
--
As of March 23, 2023. Returns for periods of 1 year and above are annualized.

Annual Total Returns Versus Peers

Loading chart...
Name
2016
2017
2018
2019
2020
2021
2022
YTD
--
--
--
--
--
--
-16.01%
3.12%
4.50%
27.19%
-14.20%
21.51%
10.65%
7.82%
-16.00%
4.58%
9.90%
27.68%
-12.23%
8.90%
2.22%
9.30%
-14.77%
3.30%
--
--
--
--
14.38%
5.16%
-18.13%
3.15%
15.60%
41.03%
-15.49%
20.57%
-1.68%
7.35%
-14.21%
0.33%
As of March 23, 2023.

Fundamentals

General
Distribution Yield Upgrade
Dividend Yield TTM (3-24-23) 3.62%
30-Day SEC Yield (2-28-23) Upgrade
7-Day SEC Yield --
Number of Holdings Upgrade
Stock
Weighted Average PE Ratio 6.874
Weighted Average Price to Sales Ratio Upgrade
Weighted Average Price to Book Ratio Upgrade
Weighted Median ROE Upgrade
Weighted Median ROA Upgrade
Forecasted Dividend Yield Upgrade
Forecasted PE Ratio Upgrade
Forecasted Price to Sales Ratio Upgrade
Forecasted Price to Book Ratio Upgrade
As of March 22, 2023

Growth Estimates

Forecasted 5 Yr Earnings Growth Upgrade
Forecasted Book Value Growth Upgrade
Forecasted Cash Flow Growth Upgrade
Forecasted Earnings Growth Upgrade
Forecasted Revenue Growth Upgrade
As of March 22, 2023

Asset Allocation

As of March 22, 2023.
Type % Net % Long % Short
Cash 0.09% Upgrade Upgrade
Stock 99.90% Upgrade Upgrade
Bond 0.00% Upgrade Upgrade
Convertible 0.00% Upgrade Upgrade
Preferred 0.01% Upgrade Upgrade
Other 0.00% Upgrade Upgrade

Top 10 Holdings

Name % Weight Price % Change
China Mengniu Dairy Co Ltd 0.98% 4.36 -2.02%
SK Hynix Inc
0.97% -- --
KE Holdings Inc ADR 0.96% 18.36 -2.34%
NetEase Inc ADR 0.94% 89.39 -0.79%
United Microelectronics Corp
0.91% -- --
POSCO Holdings Inc ADR 0.91% 61.89 -1.90%
Hyundai Motor Co 0.86% 89.00 0.00%
Kia Corp 0.82% 30.30 0.00%
Hon Hai Precision Industry Co Ltd 0.80% 3.256 0.00%
CSPC Pharmaceutical Group Ltd 0.80% 0.99 -7.48%

News

Headline
Wire
Time (ET)
No Data Available

Basic Info

Investment Strategy
The investment seeks long-term capital appreciation. The fund invests primarily in a diverse group of companies related to emerging markets across market sectors, industry groups and countries. The fund may invest in companies of all market capitalizations. Under normal market conditions, the fund will invest at least 80% of its assets in equity securities of companies related to emerging market countries. The adviser generally intends to focus its investments in a subset of the emerging markets countries that comprise the MSCI Emerging Markets Value IMI Index.
General
Security Type Exchange-Traded Fund
Equity Style Large Cap/Value
Fixed Income Style --
Broad Asset Class International Equity
Broad Category Equity
Category Name Diversified Emerging Mkts
Category Index MSCI EM NR USD
Global Category Name Global Emerging Markets Equity
YCharts Categorization Emerging Markets
YCharts Benchmark MSCI Emerging Markets Total Return (^MSEMTR)
Prospectus Objective Diversified Emerging Markets
Fund Owner Firm Name Avantis Investors
Prospectus Benchmark Index
MSCI EM IMI Value NR USD 100.0%
Broad Asset Class Benchmark Index
^MSACXUSNTR 100.0%
Manager Tenure
Daniel Ong 1.42 yrs
Eduardo Repetto 1.42 yrs
Mitchell Firestein 1.42 yrs
Ted Randall 1.42 yrs

Fundamentals

General
Distribution Yield Upgrade
Dividend Yield TTM (3-24-23) 3.62%
30-Day SEC Yield (2-28-23) Upgrade
7-Day SEC Yield --
Number of Holdings Upgrade
Stock
Weighted Average PE Ratio 6.874
Weighted Average Price to Sales Ratio Upgrade
Weighted Average Price to Book Ratio Upgrade
Weighted Median ROE Upgrade
Weighted Median ROA Upgrade
Forecasted Dividend Yield Upgrade
Forecasted PE Ratio Upgrade
Forecasted Price to Sales Ratio Upgrade
Forecasted Price to Book Ratio Upgrade
As of March 22, 2023

Growth Estimates

Forecasted 5 Yr Earnings Growth Upgrade
Forecasted Book Value Growth Upgrade
Forecasted Cash Flow Growth Upgrade
Forecasted Earnings Growth Upgrade
Forecasted Revenue Growth Upgrade
As of March 22, 2023

Fund Details

Key Dates
Inception Date 9/29/2021
Last Annual Report Date 8/31/2022
Last Prospectus Date 1/1/2023
Attributes
Index Fund No
Inverse Fund No
Leveraged Fund No
Fund of Funds No
Currency Hedged Fund No
Synthetic Replication Fund No
Has Dividend Investment Plan No
Socially Responsible Fund No

News

Headline
Wire
Time (ET)
No Data Available

Top Portfolio Holders

0 of 0