

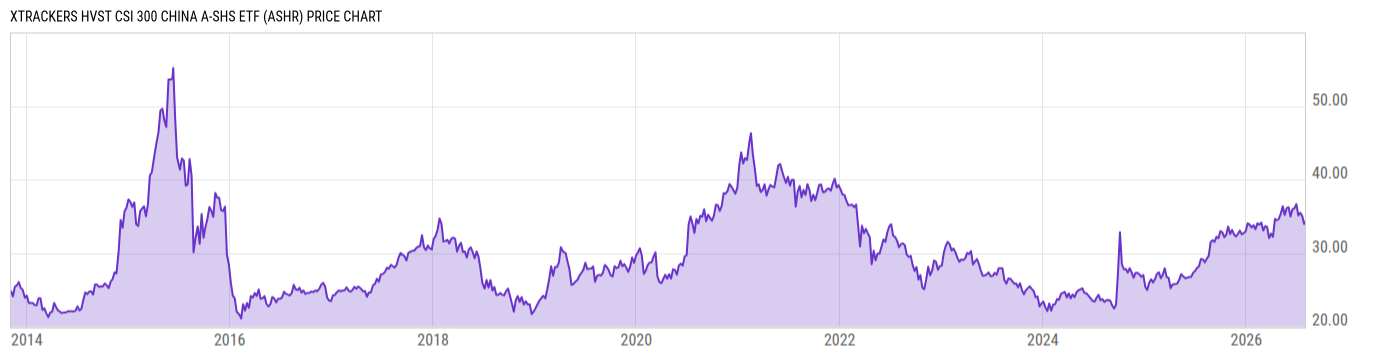
Xtrackers Hvst CSI 300 China A-Shs ETF (ASHR)
34.20
-0.07
(-0.20%)
USD |
NYSEARCA |
Jul 31, 16:00
34.05
-0.15
(-0.44%)
After-Hours: 20:00
Price Chart
Key Stats
| Net Expense Ratio | Discount or Premium to NAV | Total Assets Under Management | 30-Day Average Daily Volume |
|---|---|---|---|
| 0.65% | 0.30% | 1.553B | 4.592M |
| Weighted Average Dividend Yield | Turnover Ratio (Generic) | 1 Year Fund Level Flows | Max Drawdown (Since Inception) |
| 2.26% | 143.0% | -916.95M |
Basic Info
| Investment Strategy | |
| The Fund seeks investment results that correspond generally to the performance, before fees and expenses, of the CSI 300 Index. The Underlying Index is designed to reflect the price fluctuation and performance of the China A share market and is composed of the 300 largest and most liquid stocks in China A market. |
| General | |
| Security Type | Exchange-Traded Fund |
| Equity Style | Large Cap Core |
| Broad Asset Class | International Equity |
| Broad Category | Equity |
| Global Peer Group | Equity Greater China |
| Peer Group | China Region Funds |
| Global Macro | Equity Asia Pacific |
| US Macro | Emerging Markets Equity Funds |
| YCharts Categorization | -- |
| YCharts Benchmark | -- |
| Prospectus Objective | China Region Funds |
| Fund Owner Firm Name | DWS |
| Broad Asset Class Benchmark Index | |
| ^MSACXUSNTR | 100.0% |
Performance Versus Peer Group
Annual Total Returns Versus Peers
As of August 02, 2026.
Asset Allocation
As of May 31, 2026.
| Type | % Net |
|---|---|
| Cash | 0.15% |
| Stock | 99.85% |
| Bond | 0.00% |
| Convertible | 0.00% |
| Preferred | 0.00% |
| Other | 0.00% |
Basic Info
| Investment Strategy | |
| The Fund seeks investment results that correspond generally to the performance, before fees and expenses, of the CSI 300 Index. The Underlying Index is designed to reflect the price fluctuation and performance of the China A share market and is composed of the 300 largest and most liquid stocks in China A market. |
| General | |
| Security Type | Exchange-Traded Fund |
| Equity Style | Large Cap Core |
| Broad Asset Class | International Equity |
| Broad Category | Equity |
| Global Peer Group | Equity Greater China |
| Peer Group | China Region Funds |
| Global Macro | Equity Asia Pacific |
| US Macro | Emerging Markets Equity Funds |
| YCharts Categorization | -- |
| YCharts Benchmark | -- |
| Prospectus Objective | China Region Funds |
| Fund Owner Firm Name | DWS |
| Broad Asset Class Benchmark Index | |
| ^MSACXUSNTR | 100.0% |