

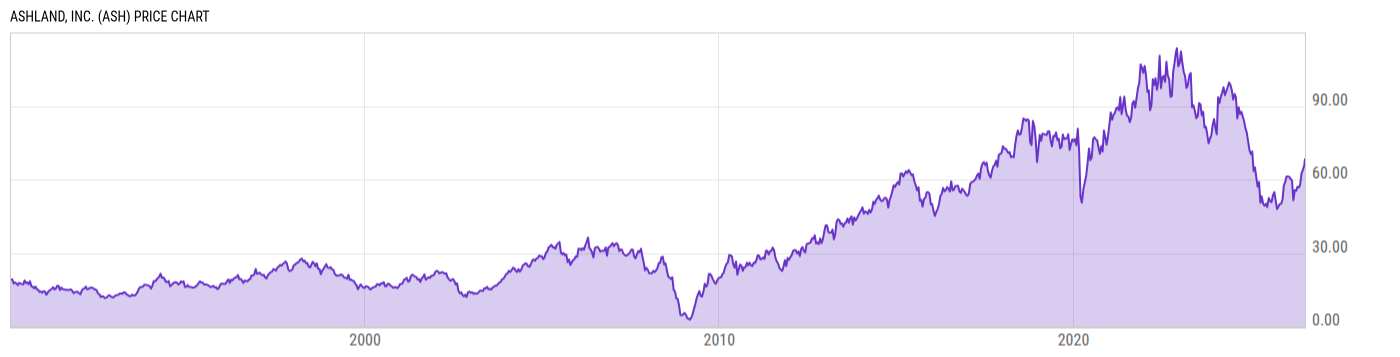
Ashland, Inc. (ASH)
68.31
+1.57
(+2.35%)
USD |
NYSE |
Jul 15, 16:00
68.31
0.00 (0.00%)
After-Hours: 20:00
Price Chart
Key Stats
| Price and Performance | |
|---|---|
| Market Cap | 3.128B |
| 52 Week High (Daily) | |
| 52 Week Low (Daily) | |
| All-Time High (Daily) | |
| Year to Date Total Returns (Daily) | |
| 1 Month Total Returns (Daily) | |
| 1 Year Total Returns (Daily) | 30.93% |
| Valuation | |
| PE Ratio | -- |
| PE Ratio (Forward) | |
| PS Ratio | 1.737 |
| Price to Book Value | 1.676 |
| EV to EBITDA | |
| Dividend | |
|---|---|
| Dividend | 0.42 |
| Dividend Yield (Forward) | |
| Financials | |
| Revenue (5 Year Growth) | |
| Revenue (Quarterly YoY Growth) | |
| EPS Diluted (5 Year Growth) | |
| EPS Diluted (Quarterly YoY Growth) | |
| Debt to Equity Ratio | 0.7921 |
| Return on Equity | |
| Return on Assets | |
| Risk | |
| Beta (5Y) | |
| Max Drawdown (5Y) | 57.30% |
Profile
| Ashland, Inc. is an additives and specialty ingredients company, which engages in the provision of architectural coatings, construction, energy, food and beverage, nutraceuticals, personal care, and pharmaceutical products. It operates through the following segments: Life Sciences, Personal Care, Specialty Additives, and Intermediates. The Life Sciences segment is involved in pharmaceuticals, nutrition, nutraceuticals, agricultural chemicals, diagnostic films, and fine chemicals. The Personal Care segment consists of biofunctionals, microbial protectants, skin care, sun care, oral care, hair care, and household solutions. The Specialty Additives segment focuses on rheology and performance-enhancing additives serving the architectural coatings, construction, energy, automotive, and various industrial markets. The Intermediates segment refers to production of 1,4 butanediol and related derivatives, including n-methylpyrrolidone. The company was founded in 1924 and is headquartered in Wilmington, DE. |
| URL | http://www.ashland.com |
| Investor Relations URL | https://investor.ashland.com/ |
| HQ State/Province | Delaware |
| Sector | Materials |
| Industry | Chemicals |
| Equity Style | Small Cap Value |
| Next Earnings Release | Jul. 28, 2026 |
| Last Earnings Release | Apr. 28, 2026 |
| Next Ex-Dividend Date | N/A |
| Last Ex-Dividend Date | Jun. 01, 2026 |