

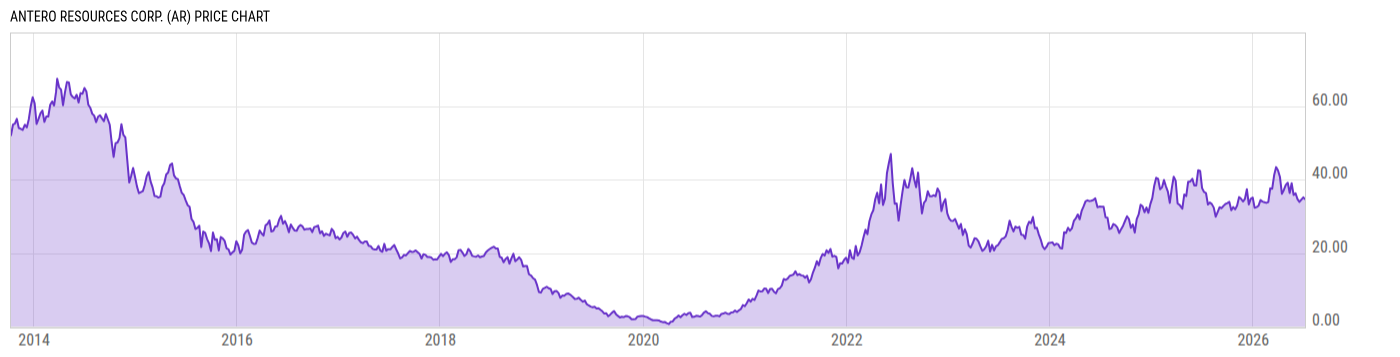
Antero Resources Corp. (AR)
34.68
-0.70
(-1.98%)
USD |
NYSE |
Jul 06, 16:00
34.67
-0.01
(-0.03%)
After-Hours: 20:00
Price Chart
Key Stats
| Price and Performance | |
|---|---|
| Market Cap | 10.74B |
| 52 Week High (Daily) | |
| 52 Week Low (Daily) | |
| All-Time High (Daily) | |
| Year to Date Total Returns (Daily) | |
| 1 Month Total Returns (Daily) | |
| 1 Year Total Returns (Daily) | -6.92% |
| Valuation | |
| PE Ratio | 11.24 |
| PE Ratio (Forward) | |
| PS Ratio | 1.876 |
| Price to Book Value | 1.333 |
| EV to EBITDA | |
| Dividend | |
|---|---|
| Dividend | -- |
| Dividend Yield (Forward) | |
| Financials | |
| Revenue (5 Year Growth) | |
| Revenue (Quarterly YoY Growth) | |
| EPS Diluted (5 Year Growth) | |
| EPS Diluted (Quarterly YoY Growth) | |
| Debt to Equity Ratio | 0.5892 |
| Return on Equity | |
| Return on Assets | |
| Risk | |
| Beta (5Y) | |
| Max Drawdown (5Y) | 59.09% |
Profile
| Antero Resources Corp. engages in the development, production, exploration, and acquisition of natural gas. It operates through the following segments: Exploration and Production, Marketing, and Equity Method Investment in Antero Midstream. The Exploration and Production segment deals with the development and production of natural gas, NGLs, and oil. The Marketing segment refers to marketing and utilization of excess firm transportation capacity. The Equity Method Investment in Antero Midstream segment represents midstream services. The company was founded by Paul M. Rady and Glen C. Warren, Jr. in June 2002 and is headquartered in Denver, CO. |
| URL | http://www.anteroresources.com |
| Investor Relations URL | https://www.anteroresources.com/investors |
| HQ State/Province | Colorado |
| Sector | Energy |
| Industry | Oil, Gas & Consumable Fuels |
| Equity Style | Small Cap Growth |
| Next Earnings Release | Jul. 29, 2026 (est.) |
| Last Earnings Release | Apr. 29, 2026 |
| Next Ex-Dividend Date | N/A |
| Last Ex-Dividend Date | N/A |