

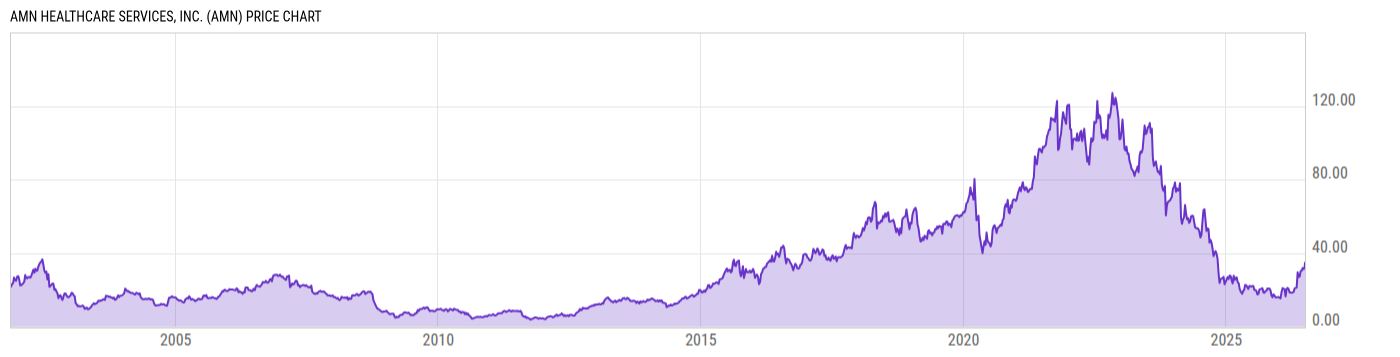
AMN Healthcare Services, Inc. (AMN)
34.66
-0.03
(-0.09%)
USD |
NYSE |
Jul 29, 16:00
34.68
+0.02
(+0.06%)
After-Hours: 20:00
Price Chart
Key Stats
| Price and Performance | |
|---|---|
| Market Cap | 1.340B |
| 52 Week High (Daily) | |
| 52 Week Low (Daily) | |
| All-Time High (Daily) | |
| Year to Date Total Returns (Daily) | |
| 1 Month Total Returns (Daily) | |
| 1 Year Total Returns (Daily) | 76.36% |
| Valuation | |
| PE Ratio | -- |
| PE Ratio (Forward) | |
| PS Ratio | 0.3927 |
| Price to Book Value | 1.880 |
| EV to EBITDA | |
| Dividend | |
|---|---|
| Dividend | -- |
| Dividend Yield (Forward) | |
| Financials | |
| Revenue (5 Year Growth) | |
| Revenue (Quarterly YoY Growth) | |
| EPS Diluted (5 Year Growth) | |
| EPS Diluted (Quarterly YoY Growth) | |
| Debt to Equity Ratio | 1.090 |
| Return on Equity | |
| Return on Assets | |
| Risk | |
| Beta (5Y) | |
| Max Drawdown (5Y) | 88.11% |
Profile
| AMN Healthcare Services, Inc. engages in the provision of healthcare workforce solutions and staffing services to healthcare facilities across the nation. Its workforce solutions include managed services programs and recruitment process outsourcing. It operates through the following segments: Nurse and Allied Solutions, Physician and Leadership Solutions, and Technology and Workforce Solutions. The Nurse and Allied Solutions segment includes travel nurse staffing, rapid response nurse staffing and labor disruption, allied staffing, local staffing, and revenue cycle solutions businesses. The Physician and Leadership Solutions segment offers locum tenens staffing, healthcare interim leadership staffing, executive search, and physician permanent placement businesses. The Technology and Workforce Solutions segment focuses on language interpretation, vendor management systems, workforce optimization, recruitment process outsourcing, education, credentialing and flex pool management businesses. The company was founded on November 10, 1997 and is headquartered in Dallas, TX. |
| URL | http://www.amnhealthcare.com |
| Investor Relations URL | https://ir.amnhealthcare.com |
| HQ State/Province | Texas |
| Sector | Health Care |
| Industry | Health Care Providers & Services |
| Equity Style | Small Cap Core |
| Next Earnings Release | Aug. 06, 2026 |
| Last Earnings Release | May. 07, 2026 |
| Next Ex-Dividend Date | N/A |
| Last Ex-Dividend Date | N/A |