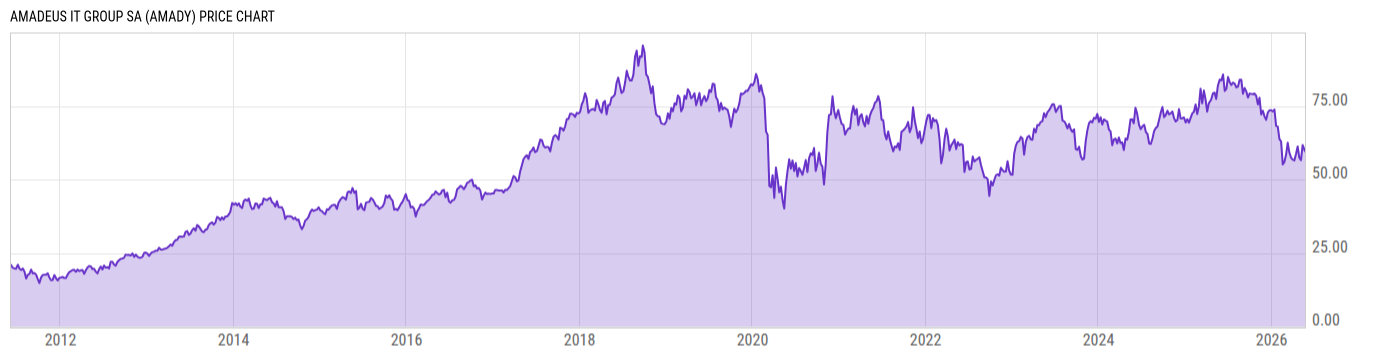
Amadeus IT Group SA (AMADY)
57.21
-0.22 (-0.38%)
USD |
OTCM |
Aug 18, 16:00
Price Chart
Key Stats
Price and Performance | |
---|---|
Market Cap | 25.74B |
52 Week High (Daily) | Upgrade |
52 Week Low (Daily) | Upgrade |
All-Time High (Daily) | Upgrade |
Year to Date Total Returns (Daily) | Upgrade |
1 Month Total Returns (Daily) | Upgrade |
1 Year Total Returns (Daily) | -3.51% |
Valuation | |
PE Ratio | 80.39 |
PE Ratio (Forward) | Upgrade |
PS Ratio | 6.512 |
Price to Book Value | 5.802 |
EV to EBITDA | Upgrade |
Dividend | |
---|---|
Dividend | -- |
Dividend Yield (Forward) | Upgrade |
Financials | |
Revenue (5 Year Growth) | Upgrade |
Revenue (Quarterly YoY Growth) | Upgrade |
EPS Diluted (5 Year Growth) | Upgrade |
EPS Diluted (Quarterly YoY Growth) | Upgrade |
Debt to Equity Ratio | 1.049 |
Return on Equity | Upgrade |
Return on Assets | Upgrade |
Risk | |
Beta (5Y) | Upgrade |
Max Drawdown (5Y) | 58.69% |
News
Headline
Wire
Time (ET)
PR Newswire
07/22 00:00
Events
DATE | TIME | TYPE | PERIOD | REPORTED EPS |
ESTIMATED EPS |
SURPRISE | |
11/04/2022* | -- | Results | Q3 2022 | -- | -- | -- | |
07/29/2022 | -- | Results | Q2 2022 | -- | -- | -- | |
05/06/2022 | -- | Results | Q1 2022 | -- | -- | -- | |
02/25/2022 | -- | Results | Q4 2021 | -- | -- | -- | |
11/05/2021 | -- | Results | Q3 2021 | -- | -- | -- | |
07/30/2021 | -- | Results | Q2 2021 | -- | -- | -- | |
05/07/2021 | -- | Results | Q1 2021 | -- | -- | -- | |
02/26/2021 | -- | Results | Q4 2020 | -- | -- | -- |
*Estimated Date/Time
Earnings
Profile
Edit
Among the top three operators, Amadeus' 40%-plus market share in air global distribution system bookings is the largest in the industry. The GDS segment represented 56% of total prepandemic revenue in 2019. The company has a growing IT solutions division (44% of 2019 revenue) that addresses the airline, airport, rail, hotel, and business intelligence markets. Transaction fees, which are tied to volume and not price, account for the bulk of revenue and profits. |
URL | http://www.amadeus.com |
Investor Relations URL | N/A |
HQ State/Province | N/A |
Sector | Consumer Cyclical |
Industry | Travel Services |
Equity Style | Large Cap/Growth |
Next Earnings Release | Nov. 04, 2022 (est.) |
Last Earnings Release | Jul. 29, 2022 |
Next Ex-Dividend Date | N/A |
Last Ex-Dividend Date | Jan. 15, 2020 |
Analyst Coverage
|
|
Low:--
High:--
|
|
Price Target Std Dev | -- |
Price Target Upside (Daily) | Upgrade |
Price Target Num Estimates | Upgrade |
Consensus Rating
|
|
Analyst Recommendation
|
Source: S&P Global
Dividends
Dividend Per Share (TTM) | 0.00 |
2017
2018
2019
2020
2021
6.00%
4.00%
2.00%
|
|
Yield to Market | 0.00 |
Yield to Sector | 0.00 |
Yield to Industry | 0.00 |
Last Dividend Amt. | -- |
Dividend Frequency | Semi-Annually |
Last Ex-Dividend Date | Jan. 15, 2020 |
Yield (TTM) | 0.00% |
Forward Yield | -- |
Payout Ratio | 0.00% |
Cash Payout Ratio | 0.00% |
Consistent Payer (5Y) | No |
Consistent Growth (5Y) | No |
Risk Info
Total Returns Comparison
Annual Total Returns Versus Peers
As of August 18, 2022.
Fundamentals
Revenue (TTM) | 4.086B |
Total Expenses (TTM) | 3.526B |
Net Income (TTM) | 330.47M |
Total Assets (Quarterly) | 12.17B |
Total Liabilities (Quarterly) | 7.734B |
Shareholders Equity (Quarterly) | 4.436B |
Cash from Operations (TTM) | 1.241B |
Cash from Investing (TTM) | -523.77M |
Cash from Financing (TTM) | -1.331B |
Ratings
Profile
Edit
Among the top three operators, Amadeus' 40%-plus market share in air global distribution system bookings is the largest in the industry. The GDS segment represented 56% of total prepandemic revenue in 2019. The company has a growing IT solutions division (44% of 2019 revenue) that addresses the airline, airport, rail, hotel, and business intelligence markets. Transaction fees, which are tied to volume and not price, account for the bulk of revenue and profits. |
URL | http://www.amadeus.com |
Investor Relations URL | N/A |
HQ State/Province | N/A |
Sector | Consumer Cyclical |
Industry | Travel Services |
Equity Style | Large Cap/Growth |
Next Earnings Release | Nov. 04, 2022 (est.) |
Last Earnings Release | Jul. 29, 2022 |
Next Ex-Dividend Date | N/A |
Last Ex-Dividend Date | Jan. 15, 2020 |
Risk Info
Ownership
Insider Ownership Percentage | Upgrade |
Jul '20
Nov '20
Mar '21
80.00%
40.00%
10.00%
Analyst Coverage
|
|
Low:--
High:--
|
|
Price Target Std Dev | -- |
Price Target Upside (Daily) | Upgrade |
Price Target Num Estimates | Upgrade |
Consensus Rating
|
|
Analyst Recommendation
|
Source: S&P Global
Top Fund Holders
Symbol | Dollars Invested | % Weight |
---|---|---|
TPICX | 3.299M USD | 2.40% |
Other Resources
Whale Wisdom | 13F Filings |
Seeking Alpha | Call Transcripts |
Morningstar | Insider Trading |
Nasdaq | Institutional Ownership |
Nasdaq | Option Chain |
SEC | SEC Filings |
AMADY Tweets |