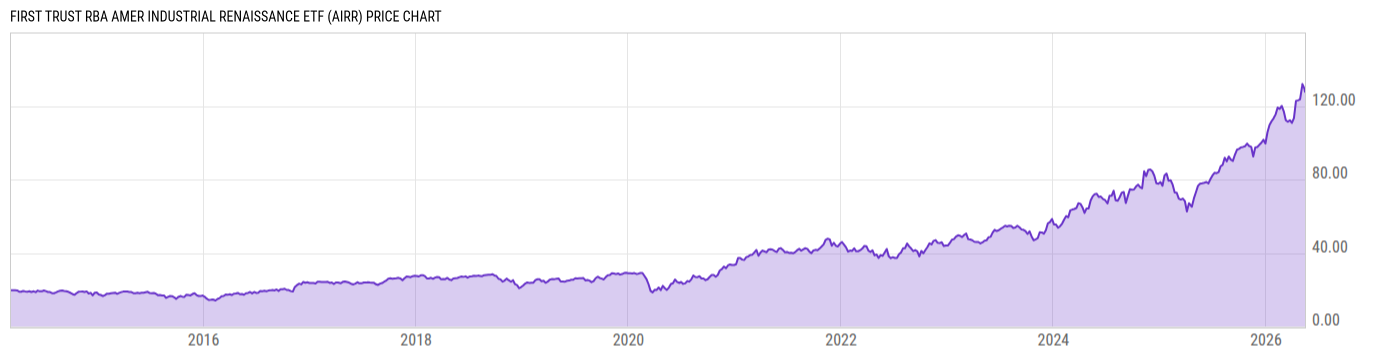
Key Stats

Expense Ratio Discount or Premium to NAV Total Assets Under Management 30-Day Average Daily Volume
0.70% 0.02% 308.90M 97493.40
Dividend Yield Turnover Ratio 1 Year Fund Level Flows Max Drawdown (All)
0.18% 37.00% 6.329M Upgrade

Basic Info

Investment Strategy
The investment seeks investment results that correspond generally to the price and yield (before the fund's fees and expenses) of an index called the Richard Bernstein Advisors American Industrial Renaissance ® Index (the "index"). The fund will normally invest at least 90% of its net assets (including investment borrowings) in the equity securities that comprise the index. The index is designed to measure the performance of small and mid cap U.S. companies in the industrial and community banking sectors.
General
Security Type Exchange-Traded Fund
Equity Style Small Cap/Blend
Fixed Income Style --
Broad Asset Class Sector Equity
Broad Category Equity
Category Name Industrials
Category Index S&P 1500 Industrials TR
Global Category Name Industrials Sector Equity
YCharts Categorization Industrials Equity
YCharts Benchmark S&P 1500 Industrials (Sector) Total Return (^SP15INSTR)
Prospectus Objective Specialty - Utility
Fund Owner Firm Name First Trust
Prospectus Benchmark Index
RBA American Industri Renaissance TR USD 100.0%
Broad Asset Class Benchmark Index
^MSWNTR 100.0%
Manager Tenure
Daniel Lindquist 8.98 yrs
David McGarel 8.98 yrs
Jon Erickson 8.98 yrs
Roger Testin 8.98 yrs
Stan Ueland 8.98 yrs
Chris Peterson 6.96 yrs
Erik Russo 2.08 yrs

Net Fund Flows Versus Category

View Net Fund Flows. Upgrade now.
1M
3M
6M
YTD
1Y
3Y
5Y
10Y
 
80.00B
60.00B
40.00B
20.00B
0
-20.00B
1 Month
% Rank: --
-- Category Low
-- Category High
1 Year
% Rank: 16
6.329M
-1.913B Category Low
2.654B Category High
3 Months
% Rank: --
-- Category Low
-- Category High
3 Years
% Rank: --
-- Category Low
-- Category High
6 Months
% Rank: --
-- Category Low
-- Category High
5 Years
% Rank: --
-- Category Low
-- Category High
YTD
% Rank: --
-- Category Low
-- Category High
10 Years
% Rank: --
-- Category Low
-- Category High
As of February 28, 2023

Performance Versus Category

 
20%
15%
10%
5%
0
View Category Returns. Upgrade now.
Name
1M
3M
YTD
1Y
3Y
5Y
10Y
15Y
Total Return (Price)
--
--
--
--
--
--
--
--
Total Return (NAV)
--
--
--
--
--
--
--
--
Category Rtn. (NAV)
--
--
--
--
--
--
--
--
% Rank in Cat (NAV)
--
--
--
--
--
--
--
--
As of March 29, 2023. Returns for periods of 1 year and above are annualized.

Annual Total Returns Versus Peers

Loading chart...
Name
2016
2017
2018
2019
2020
2021
2022
YTD
43.38%
16.28%
-20.57%
33.98%
17.17%
33.01%
-2.08%
6.95%
7.51%
22.40%
-8.71%
27.67%
15.90%
21.82%
-18.14%
5.64%
26.93%
21.55%
-17.26%
21.86%
12.11%
33.69%
-28.10%
5.16%
29.00%
17.52%
-13.20%
29.80%
12.03%
24.45%
-9.03%
5.56%
12.70%
22.82%
-16.19%
34.52%
36.39%
25.21%
-25.09%
8.71%
13.47%
25.17%
-14.40%
27.13%
11.33%
17.38%
-12.35%
5.47%
As of March 29, 2023.

Fundamentals

General
Distribution Yield Upgrade
Dividend Yield TTM (3-30-23) 0.18%
30-Day SEC Yield (1-31-23) Upgrade
7-Day SEC Yield --
Number of Holdings Upgrade
Stock
Weighted Average PE Ratio 17.27
Weighted Average Price to Sales Ratio Upgrade
Weighted Average Price to Book Ratio Upgrade
Weighted Median ROE Upgrade
Weighted Median ROA Upgrade
Forecasted Dividend Yield Upgrade
Forecasted PE Ratio Upgrade
Forecasted Price to Sales Ratio Upgrade
Forecasted Price to Book Ratio Upgrade
As of March 28, 2023

Growth Estimates

Forecasted 5 Yr Earnings Growth Upgrade
Forecasted Book Value Growth Upgrade
Forecasted Cash Flow Growth Upgrade
Forecasted Earnings Growth Upgrade
Forecasted Revenue Growth Upgrade
As of March 28, 2023

Asset Allocation

As of March 28, 2023.
Type % Net % Long % Short
Cash 0.28% Upgrade Upgrade
Stock 99.72% Upgrade Upgrade
Bond 0.00% Upgrade Upgrade
Convertible 0.00% Upgrade Upgrade
Preferred 0.00% Upgrade Upgrade
Other 0.00% Upgrade Upgrade

Top 10 Holdings

Name % Weight Price % Change
Encore Wire Corp 3.93% 183.50 1.97%
Comfort Systems USA Inc 3.86% 140.31 -2.54%
Proto Labs Inc 3.68% 31.76 1.28%
Greenbrier Companies Inc 3.65% 31.76 -0.35%
Atkore Inc 3.60% 141.40 3.04%
Mueller Water Products, Inc. Class A 3.54% 13.53 0.74%
Quanta Services Inc 3.52% 166.05 0.36%
Federal Signal Corp 3.49% 53.57 0.62%
EMCOR Group Inc 3.48% 160.09 -0.29%
Clean Harbors Inc 3.47% 139.33 3.09%

Basic Info

Investment Strategy
The investment seeks investment results that correspond generally to the price and yield (before the fund's fees and expenses) of an index called the Richard Bernstein Advisors American Industrial Renaissance ® Index (the "index"). The fund will normally invest at least 90% of its net assets (including investment borrowings) in the equity securities that comprise the index. The index is designed to measure the performance of small and mid cap U.S. companies in the industrial and community banking sectors.
General
Security Type Exchange-Traded Fund
Equity Style Small Cap/Blend
Fixed Income Style --
Broad Asset Class Sector Equity
Broad Category Equity
Category Name Industrials
Category Index S&P 1500 Industrials TR
Global Category Name Industrials Sector Equity
YCharts Categorization Industrials Equity
YCharts Benchmark S&P 1500 Industrials (Sector) Total Return (^SP15INSTR)
Prospectus Objective Specialty - Utility
Fund Owner Firm Name First Trust
Prospectus Benchmark Index
RBA American Industri Renaissance TR USD 100.0%
Broad Asset Class Benchmark Index
^MSWNTR 100.0%
Manager Tenure
Daniel Lindquist 8.98 yrs
David McGarel 8.98 yrs
Jon Erickson 8.98 yrs
Roger Testin 8.98 yrs
Stan Ueland 8.98 yrs
Chris Peterson 6.96 yrs
Erik Russo 2.08 yrs

Fundamentals

General
Distribution Yield Upgrade
Dividend Yield TTM (3-30-23) 0.18%
30-Day SEC Yield (1-31-23) Upgrade
7-Day SEC Yield --
Number of Holdings Upgrade
Stock
Weighted Average PE Ratio 17.27
Weighted Average Price to Sales Ratio Upgrade
Weighted Average Price to Book Ratio Upgrade
Weighted Median ROE Upgrade
Weighted Median ROA Upgrade
Forecasted Dividend Yield Upgrade
Forecasted PE Ratio Upgrade
Forecasted Price to Sales Ratio Upgrade
Forecasted Price to Book Ratio Upgrade
As of March 28, 2023

Growth Estimates

Forecasted 5 Yr Earnings Growth Upgrade
Forecasted Book Value Growth Upgrade
Forecasted Cash Flow Growth Upgrade
Forecasted Earnings Growth Upgrade
Forecasted Revenue Growth Upgrade
As of March 28, 2023

Fund Details

Key Dates
Inception Date 3/10/2014
Last Annual Report Date 9/30/2022
Last Prospectus Date 2/1/2023
Attributes
Index Fund Yes
Inverse Fund No
Leveraged Fund No
Fund of Funds No
Currency Hedged Fund No
Synthetic Replication Fund No
Has Dividend Investment Plan No
Socially Responsible Fund No

Top Portfolio Holders

0 of 0