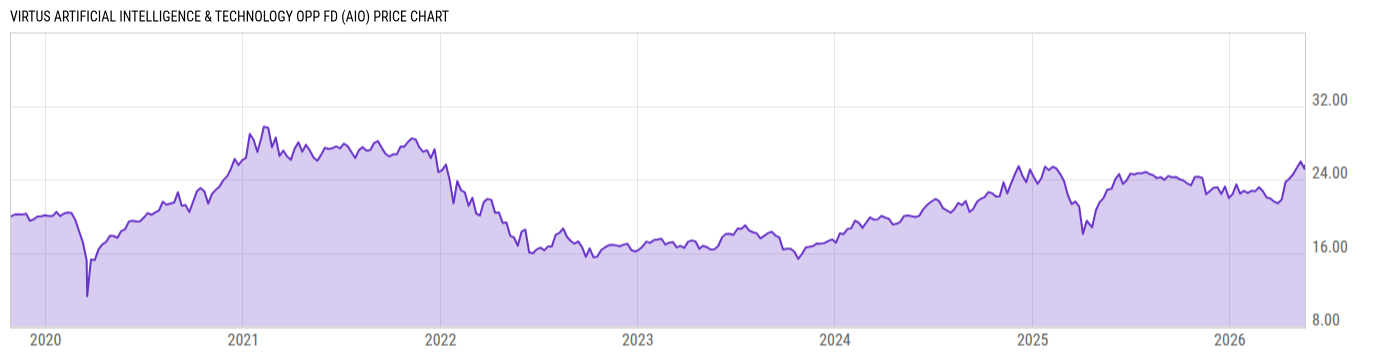
Key Stats

Expense Ratio Discount or Premium to NAV Total Assets Under Management 30-Day Average Daily Volume
1.47% -11.38% 653.36M 111047.8
Dividend Yield Turnover Ratio 1 Year Fund Level Flows Max Drawdown (All)
0.05% 53.00% -- Upgrade

Basic Info

Investment Strategy
To generate a stable income stream and growth of capital by focusing on one of the most significant long-term secular growth opportunities in markets today.
General
Security Type Closed-End Fund
Equity Style Large Cap/Growth
Fixed Income Style --
Broad Asset Class Sector Equity
Broad Category Equity
Category Name Technology
Category Index Morningstar US Tech TR USD
Global Category Name Technology Sector Equity
YCharts Categorization Technology Equity
YCharts Benchmark S&P 1500 Information Technology (Sector) Total Return (^SP15IFTSTR)
Prospectus Objective Specialty - Technology
Fund Owner Firm Name Virtus Investment Advisers, Inc.
Prospectus Benchmark Index
MSCI AC World Total Return 100.0%
Broad Asset Class Benchmark Index
^MSWNTR 100.0%
Manager Tenure
James Chen 3.33 yrs
Justin Kass 3.33 yrs
Stephen Jue 3.33 yrs
David Oberto 0.73 yrs
Ethan Turner 0.09 yrs

Net Fund Flows Versus Category

1M
3M
6M
YTD
1Y
3Y
5Y
10Y
 
80.00B
60.00B
40.00B
20.00B
0
-20.00B
No Data Available
1 Month
% Rank: --
-- Category Low
-- Category High
1 Year
% Rank: --
-1.996B Category Low
1.840B Category High
3 Months
% Rank: --
-- Category Low
-- Category High
3 Years
% Rank: --
-- Category Low
-- Category High
6 Months
% Rank: --
-- Category Low
-- Category High
5 Years
% Rank: --
-- Category Low
-- Category High
YTD
% Rank: --
-- Category Low
-- Category High
10 Years
% Rank: --
-- Category Low
-- Category High
Date Unavailable

Performance Versus Category

 
20%
15%
10%
5%
0
View Category Returns. Upgrade now.
Name
1M
3M
YTD
1Y
3Y
5Y
10Y
15Y
Total Return (Price)
--
--
--
--
--
--
--
--
Total Return (NAV)
--
--
--
--
--
--
--
--
Category Rtn. (NAV)
--
--
--
--
--
--
--
--
% Rank in Cat (NAV)
--
--
--
--
--
--
--
--
As of March 23, 2023. Returns for periods of 1 year and above are annualized.

Annual Total Returns Versus Peers

Loading chart...
Name
2016
2017
2018
2019
2020
2021
2022
YTD
7.51%
22.40%
-8.71%
27.67%
15.90%
21.82%
-18.14%
3.98%
3.00%
40.05%
-5.08%
28.76%
61.36%
-5.57%
-47.92%
20.33%
35.53%
38.44%
-9.04%
64.44%
55.54%
42.14%
-33.52%
27.48%
15.02%
34.25%
-1.66%
49.86%
43.61%
34.74%
-27.73%
17.25%
25.36%
37.79%
-4.62%
48.21%
38.73%
26.89%
-39.83%
20.12%
As of March 23, 2023.

Fundamentals

General
Distribution Yield Upgrade
Dividend Yield TTM (3-24-23) 0.05%
30-Day SEC Yield --
7-Day SEC Yield --
Number of Holdings Upgrade
Stock
Weighted Average PE Ratio 23.17
Weighted Average Price to Sales Ratio Upgrade
Weighted Average Price to Book Ratio Upgrade
Weighted Median ROE Upgrade
Weighted Median ROA Upgrade
Forecasted Dividend Yield Upgrade
Forecasted PE Ratio Upgrade
Forecasted Price to Sales Ratio Upgrade
Forecasted Price to Book Ratio Upgrade
Bond
Current Yield 2.95%
Yield to Maturity --
Effective Duration --
Average Coupon Upgrade
Average Credit Score --
Average Price --
As of February 28, 2023

Fund Details

Key Dates
Inception Date 10/31/2019
Last Annual Report Date 1/31/2022
Last Prospectus Date 10/28/2019
Attributes
Index Fund No
Inverse Fund No
Leveraged Fund No
Fund of Funds No
Currency Hedged Fund No
Synthetic Replication Fund No
Has Dividend Investment Plan Yes
Socially Responsible Fund No

Asset Allocation

As of February 28, 2023.
Type % Net % Long % Short
Cash -15.75% Upgrade Upgrade
Stock 54.15% Upgrade Upgrade
Bond 18.85% Upgrade Upgrade
Convertible 40.28% Upgrade Upgrade
Preferred 2.46% Upgrade Upgrade
Other 0.00% Upgrade Upgrade

Top 10 Holdings

Name % Weight Price % Change
BlackRock Liquidity FedFund Instl 5.32% 1.00 0.00%
Deere & Co 3.08% 386.50 -1.37%
UnitedHealth Group Inc 2.89% 475.99 1.29%
SLB 2.10% 44.57 -2.00%
Flex Ltd 1.93% 20.99 -2.19%
Oracle Corp 1.89% 88.01 0.26%
NXP Semiconductors NV 1.76% 176.55 -3.02%
Microchip Technology Incorporated 0.125%
1.75% -- --
Cadence Design Systems Inc 1.72% 204.48 -1.22%
Elevance Health Inc 1.70% 456.69 2.33%

Basic Info

Investment Strategy
To generate a stable income stream and growth of capital by focusing on one of the most significant long-term secular growth opportunities in markets today.
General
Security Type Closed-End Fund
Equity Style Large Cap/Growth
Fixed Income Style --
Broad Asset Class Sector Equity
Broad Category Equity
Category Name Technology
Category Index Morningstar US Tech TR USD
Global Category Name Technology Sector Equity
YCharts Categorization Technology Equity
YCharts Benchmark S&P 1500 Information Technology (Sector) Total Return (^SP15IFTSTR)
Prospectus Objective Specialty - Technology
Fund Owner Firm Name Virtus Investment Advisers, Inc.
Prospectus Benchmark Index
MSCI AC World Total Return 100.0%
Broad Asset Class Benchmark Index
^MSWNTR 100.0%
Manager Tenure
James Chen 3.33 yrs
Justin Kass 3.33 yrs
Stephen Jue 3.33 yrs
David Oberto 0.73 yrs
Ethan Turner 0.09 yrs

Fundamentals

General
Distribution Yield Upgrade
Dividend Yield TTM (3-24-23) 0.05%
30-Day SEC Yield --
7-Day SEC Yield --
Number of Holdings Upgrade
Stock
Weighted Average PE Ratio 23.17
Weighted Average Price to Sales Ratio Upgrade
Weighted Average Price to Book Ratio Upgrade
Weighted Median ROE Upgrade
Weighted Median ROA Upgrade
Forecasted Dividend Yield Upgrade
Forecasted PE Ratio Upgrade
Forecasted Price to Sales Ratio Upgrade
Forecasted Price to Book Ratio Upgrade
Bond
Current Yield 2.95%
Yield to Maturity --
Effective Duration --
Average Coupon Upgrade
Average Credit Score --
Average Price --
As of February 28, 2023

Fund Details

Key Dates
Inception Date 10/31/2019
Last Annual Report Date 1/31/2022
Last Prospectus Date 10/28/2019
Attributes
Index Fund No
Inverse Fund No
Leveraged Fund No
Fund of Funds No
Currency Hedged Fund No
Synthetic Replication Fund No
Has Dividend Investment Plan Yes
Socially Responsible Fund No

Top Portfolio Holders

0 of 0