

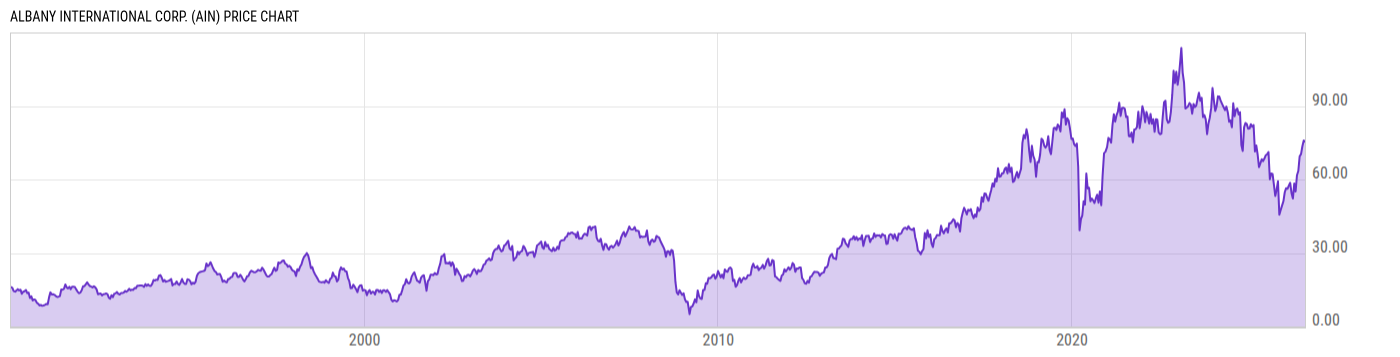
Albany International Corp. (AIN)
75.48
+0.97
(+1.30%)
USD |
NYSE |
Aug 03, 13:42
Price Chart
Key Stats
| Price and Performance | |
|---|---|
| Market Cap | 2.140B |
| 52 Week High (Daily) | |
| 52 Week Low (Daily) | |
| All-Time High (Daily) | |
| Year to Date Total Returns (Daily) | |
| 1 Month Total Returns (Daily) | |
| 1 Year Total Returns (Daily) | 40.24% |
| Valuation | |
| PE Ratio | -- |
| PE Ratio (Forward) | |
| PS Ratio | 1.822 |
| Price to Book Value | 2.934 |
| EV to EBITDA | |
| Dividend | |
|---|---|
| Dividend | 0.28 |
| Dividend Yield (Forward) | |
| Financials | |
| Revenue (5 Year Growth) | |
| Revenue (Quarterly YoY Growth) | |
| EPS Diluted (5 Year Growth) | |
| EPS Diluted (Quarterly YoY Growth) | |
| Debt to Equity Ratio | 0.6533 |
| Return on Equity | |
| Return on Assets | |
| Risk | |
| Beta (5Y) | |
| Max Drawdown (5Y) | 62.27% |
Profile
| Albany International Corp. engages in textiles and materials processing. It operates through the following segments: Machine Clothing and Albany Engineered Composites. The Machine Clothing segment supplies fabrics used in the manufacturing process in the pulp, corrugator, nonwovens, fiber cement, building products, and tannery and textile industries. The Engineered Composites segment provides composite structures to customers in the commercial and defense aerospace industries. The firm offers regular fabric, consultative, diagnostic, and project specific services. The company was founded on March 8, 1895 and is headquartered in Portsmouth, NH. |
| URL | http://www.albint.com |
| Investor Relations URL | https://investors.albint.com/ |
| HQ State/Province | New Hampshire |
| Sector | Industrials |
| Industry | Machinery |
| Equity Style | Small Cap Core |
| Next Earnings Release | Aug. 04, 2026 |
| Last Earnings Release | Apr. 30, 2026 |
| Next Ex-Dividend Date | N/A |
| Last Ex-Dividend Date | Jun. 05, 2026 |