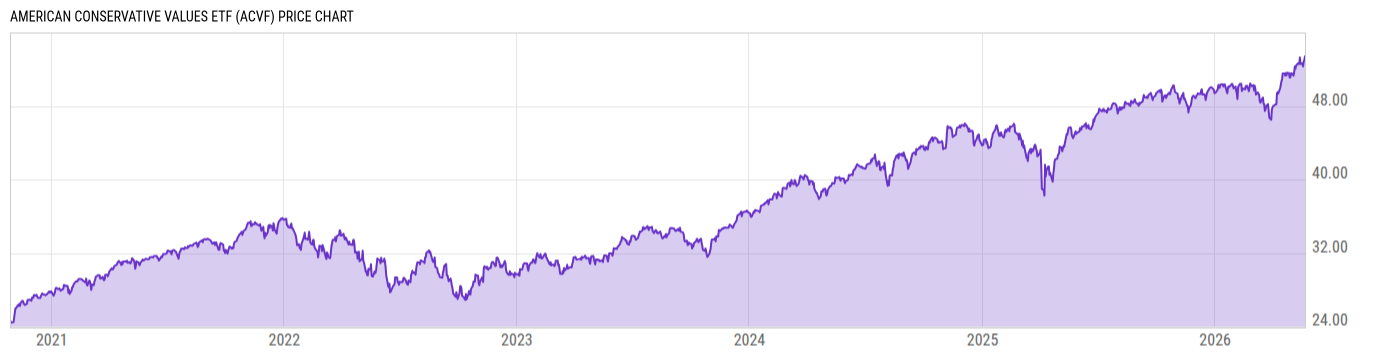
American Conservative Values ETF (ACVF)
30.83
+0.40
(+1.30%)
USD |
NYSEARCA |
Mar 29, 16:00
Key Stats
Expense Ratio | Discount or Premium to NAV | Total Assets Under Management | 30-Day Average Daily Volume |
---|---|---|---|
0.75% | -0.05% | 38.05M | 4119.07 |
Dividend Yield | Turnover Ratio | 1 Year Fund Level Flows | Max Drawdown (All) |
0.94% | 3.70% | 6.880M | Upgrade |
Basic Info
Investment Strategy | |
The investment seeks to achieve long-term capital appreciation; capital preservation is the secondary objective. Under normal circumstances, the fund seeks to meet its investment objective by investing at least 80% of its net assets, plus borrowings for investment purposes, if any, in equity securities of U.S. companies that meet its politically conservative criteria. The equity securities in which it invests will generally be those of companies with large market capitalizations. |
General | |
Security Type | Exchange-Traded Fund |
Equity Style | Large Cap/Blend |
Fixed Income Style | -- |
Broad Asset Class | US Equity |
Broad Category | Equity |
Category Name | Large Blend |
Category Index | Russell 1000 TR USD |
Global Category Name | US Equity Large Cap Blend |
YCharts Categorization | US Large Cap Blend |
YCharts Benchmark | S&P 500 Total Return (^SPXTR) |
Prospectus Objective | Growth |
Fund Owner Firm Name | ACV ETFs |
Prospectus Benchmark Index | |
S&P 500 TR USD | 100.0% |
Broad Asset Class Benchmark Index | |
^SPXTR | 100.0% |
Manager Tenure | |
Austin Wen | 2.34 yrs |
Rafael Zayas | 2.34 yrs |
Tom Carter | 2.34 yrs |
Net Fund Flows Versus Category
1 Month
% Rank:
--
--
Category Low
--
Category High
1 Year
% Rank:
27
6.880M
-24.24B
Category Low
51.36B
Category High
3 Months
% Rank:
--
--
Category Low
--
Category High
3 Years
% Rank:
--
--
Category Low
--
Category High
6 Months
% Rank:
--
--
Category Low
--
Category High
5 Years
% Rank:
--
--
Category Low
--
Category High
YTD
% Rank:
--
--
Category Low
--
Category High
10 Years
% Rank:
--
--
Category Low
--
Category High
As of February 28, 2023
Risk
Performance Versus Category
As of March 29, 2023. Returns for periods of 1 year and above are annualized.
Annual Total Returns Versus Peers
As of March 29, 2023.
Asset Allocation
Top 10 Holdings
Name | % Weight | Price | % Change |
---|---|---|---|
Microsoft Corp | 7.05% | 284.05 | 1.26% |
Cisco Systems Inc | 3.89% | 51.42 | 0.49% |
NVIDIA Corp | 2.99% | 273.70 | 1.43% |
The Home Depot Inc | 2.81% | 285.32 | 0.69% |
Berkshire Hathaway Inc Class B | 2.66% | 305.05 | -0.08% |
Mastercard Inc Class A | 2.59% | 359.06 | -0.13% |
Tesla Inc | 2.49% | 195.20 | 0.68% |
Costco Wholesale Corp | 2.05% | 491.38 | 0.10% |
Procter & Gamble Co | 2.00% | 147.40 | 0.40% |
Exxon Mobil Corp | 1.86% | 109.46 | 0.46% |
News
Headline
Wire
Time (ET)
Accesswire
10/17 15:00
PR Newswire
05/12 12:10
PR Newswire
04/05 09:00
PR Newswire
11/15 10:40
PR Newswire
02/08 16:51
Basic Info
Investment Strategy | |
The investment seeks to achieve long-term capital appreciation; capital preservation is the secondary objective. Under normal circumstances, the fund seeks to meet its investment objective by investing at least 80% of its net assets, plus borrowings for investment purposes, if any, in equity securities of U.S. companies that meet its politically conservative criteria. The equity securities in which it invests will generally be those of companies with large market capitalizations. |
General | |
Security Type | Exchange-Traded Fund |
Equity Style | Large Cap/Blend |
Fixed Income Style | -- |
Broad Asset Class | US Equity |
Broad Category | Equity |
Category Name | Large Blend |
Category Index | Russell 1000 TR USD |
Global Category Name | US Equity Large Cap Blend |
YCharts Categorization | US Large Cap Blend |
YCharts Benchmark | S&P 500 Total Return (^SPXTR) |
Prospectus Objective | Growth |
Fund Owner Firm Name | ACV ETFs |
Prospectus Benchmark Index | |
S&P 500 TR USD | 100.0% |
Broad Asset Class Benchmark Index | |
^SPXTR | 100.0% |
Manager Tenure | |
Austin Wen | 2.34 yrs |
Rafael Zayas | 2.34 yrs |
Tom Carter | 2.34 yrs |
Fundamentals
General | |
Distribution Yield | Upgrade |
Dividend Yield TTM (3-29-23) | 0.94% |
30-Day SEC Yield | -- |
7-Day SEC Yield | -- |
Number of Holdings | Upgrade |
Stock | |
Weighted Average PE Ratio | 21.41 |
Weighted Average Price to Sales Ratio | Upgrade |
Weighted Average Price to Book Ratio | Upgrade |
Weighted Median ROE | Upgrade |
Weighted Median ROA | Upgrade |
Forecasted Dividend Yield | Upgrade |
Forecasted PE Ratio | Upgrade |
Forecasted Price to Sales Ratio | Upgrade |
Forecasted Price to Book Ratio | Upgrade |
As of March 28, 2023
Fund Details
Key Dates | |
Inception Date | 10/28/2020 |
Last Annual Report Date | 7/31/2022 |
Last Prospectus Date | 11/30/2022 |
Attributes | |
Index Fund | No |
Inverse Fund | No |
Leveraged Fund | No |
Fund of Funds | No |
Currency Hedged Fund | No |
Synthetic Replication Fund | No |
Has Dividend Investment Plan | No |
Socially Responsible Fund | No |
News
Headline
Wire
Time (ET)
Accesswire
10/17 15:00
PR Newswire
05/12 12:10
PR Newswire
04/05 09:00
PR Newswire
11/15 10:40
PR Newswire
02/08 16:51