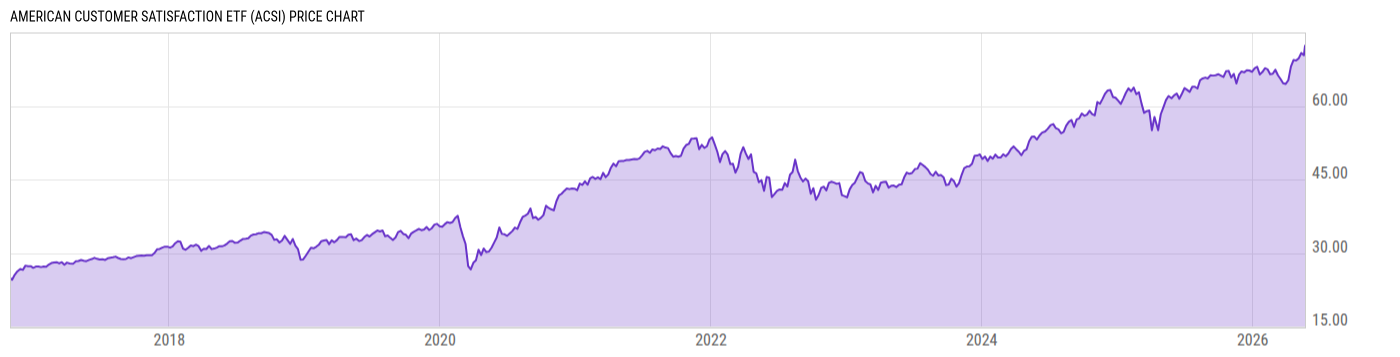
American Customer Satisfaction ETF (ACSI)
42.66
-0.12 (-0.27%)
USD |
BATS |
May 19, 16:00
Price Chart
Key Stats
Customize
Expense Ratio | Discount or Premium to NAV | Total Assets Under Management | 30-Day Average Daily Volume |
---|---|---|---|
0.65% | 0.05% | 67.46M | 336.30 |
Dividend Yield | Turnover Ratio | 1 Year Fund Level Flows | Max Drawdown (All) |
0.39% | 50.00% | 148518.6 | Upgrade |
Basic Info
Investment Strategy | |
The investment seeks to track the performance of the American Customer Satisfaction Investable Index. Under normal circumstances, at least 80% of the fund's net assets, plus borrowings for investment purposes, will be invested in investments that are tied economically to the United States. Construction of the index begins with over 400 ACSI Companies across 46 industries and 10 economic sectors. The initial universe is then screened to eliminate companies whose stock is not principally listed on a U.S. exchange, whose market capitalization is less than $1 billion, or for which the Customer Satisfaction Data is statistically insignificant. |
General | |
Security Type | Exchange-Traded Fund |
Equity Style | Large Cap/Blend |
Fixed Income Style | -- |
Broad Asset Class | US Equity |
Broad Category | Equity |
Category Name | Large Blend |
Category Index | Russell 1000 TR USD |
Prospectus Objective | Growth and Income |
Fund Owner Firm Name | Exponential ETFs |
Prospectus Benchmark Index | |
American Customer Satsftn Invst TR USD | 100.0% |
Broad Asset Class Benchmark Index | |
^SPXTR | 100.0% |
Manager Tenure | |
Charles Ragauss | 5.50 yrs |
Michael Venuto | 0.94 yrs |
Net Fund Flows Versus Category
1 Month
% Rank:
--
--
Category Low
--
Category High
1 Year
% Rank:
38
148518.6
-22.34B
Category Low
40.52B
Category High
3 Months
% Rank:
--
--
Category Low
--
Category High
3 Years
% Rank:
--
--
Category Low
--
Category High
6 Months
% Rank:
--
--
Category Low
--
Category High
5 Years
% Rank:
--
--
Category Low
--
Category High
YTD
% Rank:
--
--
Category Low
--
Category High
10 Years
% Rank:
--
--
Category Low
--
Category High
As of April 30, 2022
Performance Versus Category
As of May 19, 2022. Returns for periods of 1 year and above are annualized.
Annual Total Returns Versus Peers
As of May 19, 2022.
Asset Allocation
Top 10 Holdings
Name | % Weight | Price | % Change |
---|---|---|---|
Apple Inc | 9.79% | 137.35 | -2.46% |
FedEx Corp | 4.91% | 199.05 | -2.22% |
HP Inc | 4.58% | 35.73 | -3.04% |
Costco Wholesale Corp | 4.38% | 422.93 | -1.51% |
The Hershey Co | 4.23% | 205.12 | -1.24% |
CVS Health Corp | 4.16% | 93.14 | -0.94% |
Charles Schwab Corp | 4.16% | 62.66 | -0.96% |
Microsoft Corp | 4.01% | 253.14 | -0.37% |
Tesla Inc | 3.98% | 709.42 | -0.05% |
Alphabet Inc Class C | 3.89% | 2214.91 | -1.47% |
News
Headline
Wire
Time (ET)
Business Wire
05/17 08:30
Business Wire
02/21 08:30
Business Wire
02/15 16:18
Basic Info
Investment Strategy | |
The investment seeks to track the performance of the American Customer Satisfaction Investable Index. Under normal circumstances, at least 80% of the fund's net assets, plus borrowings for investment purposes, will be invested in investments that are tied economically to the United States. Construction of the index begins with over 400 ACSI Companies across 46 industries and 10 economic sectors. The initial universe is then screened to eliminate companies whose stock is not principally listed on a U.S. exchange, whose market capitalization is less than $1 billion, or for which the Customer Satisfaction Data is statistically insignificant. |
General | |
Security Type | Exchange-Traded Fund |
Equity Style | Large Cap/Blend |
Fixed Income Style | -- |
Broad Asset Class | US Equity |
Broad Category | Equity |
Category Name | Large Blend |
Category Index | Russell 1000 TR USD |
Prospectus Objective | Growth and Income |
Fund Owner Firm Name | Exponential ETFs |
Prospectus Benchmark Index | |
American Customer Satsftn Invst TR USD | 100.0% |
Broad Asset Class Benchmark Index | |
^SPXTR | 100.0% |
Manager Tenure | |
Charles Ragauss | 5.50 yrs |
Michael Venuto | 0.94 yrs |
Fundamentals
General | |
Distribution Yield | Upgrade |
Dividend Yield TTM (5-19-22) | 0.39% |
30-Day SEC Yield (12-31-21) | Upgrade |
7-Day SEC Yield | -- |
Number of Holdings | Upgrade |
Stock | |
Weighted Average PE Ratio | 16.63 |
Weighted Average Price to Sales Ratio | Upgrade |
Weighted Average Price to Book Ratio | Upgrade |
Weighted Median ROE | Upgrade |
Weighted Median ROA | Upgrade |
Forecasted Dividend Yield | Upgrade |
Forecasted PE Ratio | Upgrade |
Forecasted Price to Sales Ratio | Upgrade |
Forecasted Price to Book Ratio | Upgrade |
As of May 17, 2022
Growth Estimates
Fund Details
Key Dates | |
Inception Date | 10/31/2016 |
Last Annual Report Date | 9/30/2021 |
Last Prospectus Date | 1/28/2022 |
Attributes | |
Enhanced Index Fund | No |
Index Fund |
|
Inverse Fund | No |
Leveraged Fund | No |
Fund of Funds | No |
Currency Hedged Fund | No |
Synthetic Replication Fund | No |
Has Dividend Investment Plan | No |
Socially Responsible Fund | No |
News
Headline
Wire
Time (ET)
Business Wire
05/17 08:30
Business Wire
02/21 08:30
Business Wire
02/15 16:18