

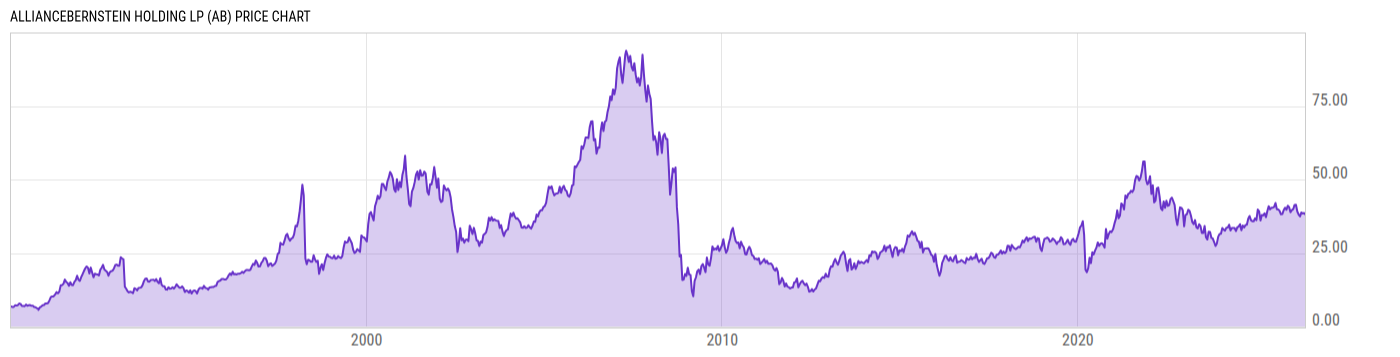
AllianceBernstein Holding LP (AB)
38.06
-0.06
(-0.16%)
USD |
NYSE |
May 15, 16:00
38.00
-0.06
(-0.16%)
Pre-Market: 06:40
Price Chart
Key Stats
| Price and Performance | |
|---|---|
| Market Cap | 3.555B |
| 52 Week High (Daily) | |
| 52 Week Low (Daily) | |
| All-Time High (Daily) | |
| Year to Date Total Returns (Daily) | |
| 1 Month Total Returns (Daily) | |
| 1 Year Total Returns (Daily) | 2.48% |
| Valuation | |
| PE Ratio | 11.70 |
| PE Ratio (Forward) | |
| PS Ratio | -- |
| Price to Book Value | 2.822 |
| EV to EBITDA | |
| Dividend | |
|---|---|
| Dividend | 0.83 |
| Dividend Yield (Forward) | |
| Financials | |
| Revenue (5 Year Growth) | |
| Revenue (Quarterly YoY Growth) | |
| EPS Diluted (5 Year Growth) | |
| EPS Diluted (Quarterly YoY Growth) | |
| Debt to Equity Ratio | 0.00 |
| Return on Equity | |
| Return on Assets | |
| Risk | |
| Beta (5Y) | |
| Max Drawdown (5Y) | 45.81% |
Profile
| AllianceBernstein Holding LP engages in the provision of research, investment management, and related services. It offers investment trusts, mutual funds, hedge funds, and other investment vehicles. The company was founded in 1967 and is headquartered in Nashville, TN. |
| URL | http://www.alliancebernstein.com |
| Investor Relations URL | https://www.alliancebernstein.com/corporate/en/investor-relations.html |
| HQ State/Province | Tennessee |
| Sector | Financials |
| Industry | Capital Markets |
| Next Earnings Release | Jul. 23, 2026 (est.) |
| Last Earnings Release | Apr. 28, 2026 |
| Next Ex-Dividend Date | N/A |
| Last Ex-Dividend Date | May. 08, 2026 |