

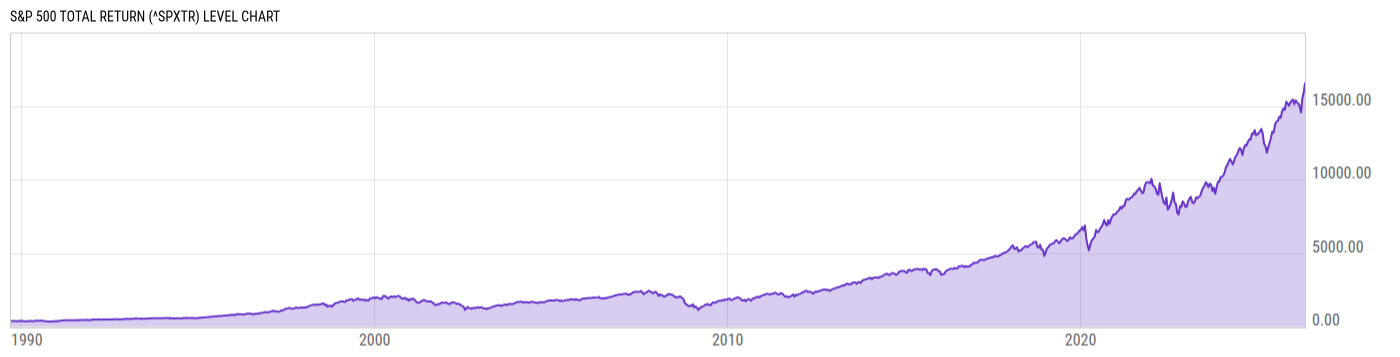
S&P 500 Total Return (^SPXTR)
16812.36
+14.44
(+0.09%)
USD |
May 27, 10:21
Level Chart
Key Stats
Basic Info
| The S&P 500 index covers the 500 largest companies that are in the United States. These companies can vary across various sectors. The S&P 500 is one of the most important indices in the world as it widely tracks how the United States stock market is performing. The S&P 500 has had several major drawdowns that have been greater than 40% during recessionary periods including in 1974, 2002, and 2009. | |
| Core Index Name | S&P 500 |
| Return Type | Total Return |
| Currency Code | USD |
| Category Hedge Type | Not Hedged |
Index Varieties
| Return Types | |
| Net Total Return | S&P 500 Net Total Return |
| Price Return | S&P 500 |
| Currencies | |
| AUD | S&P 500 Total Return AUD |
| BRL | S&P 500 Total Return BRL |
| CAD | S&P 500 Total Return CAD |
| CHF | S&P 500 Total Return CHF |
| CNH | S&P 500 Total Return CNH |
| CNY | S&P 500 Total Return CNY |
| EUR | S&P 500 Total Return EUR |
| GBP | S&P 500 Total Return GBP |
Total Return Performance
As of May 26, 2026.
Returns for periods of 1 year and above are annualized.
Annual Performance
As of May 27, 2026.
Basic Info
| The S&P 500 index covers the 500 largest companies that are in the United States. These companies can vary across various sectors. The S&P 500 is one of the most important indices in the world as it widely tracks how the United States stock market is performing. The S&P 500 has had several major drawdowns that have been greater than 40% during recessionary periods including in 1974, 2002, and 2009. | |
| Core Index Name | S&P 500 |
| Return Type | Total Return |
| Currency Code | USD |
| Category Hedge Type | Not Hedged |
Index Varieties
| Return Types | |
| Net Total Return | S&P 500 Net Total Return |
| Price Return | S&P 500 |
| Currencies | |
| AUD | S&P 500 Total Return AUD |
| BRL | S&P 500 Total Return BRL |
| CAD | S&P 500 Total Return CAD |
| CHF | S&P 500 Total Return CHF |
| CNH | S&P 500 Total Return CNH |
| CNY | S&P 500 Total Return CNY |
| EUR | S&P 500 Total Return EUR |
| GBP | S&P 500 Total Return GBP |