

S&P 500 Operating Earnings Yield (DISCONTINUED) (I:SP500OEY)
3.81% for Q3 2025
Level Chart
Basic Info
|
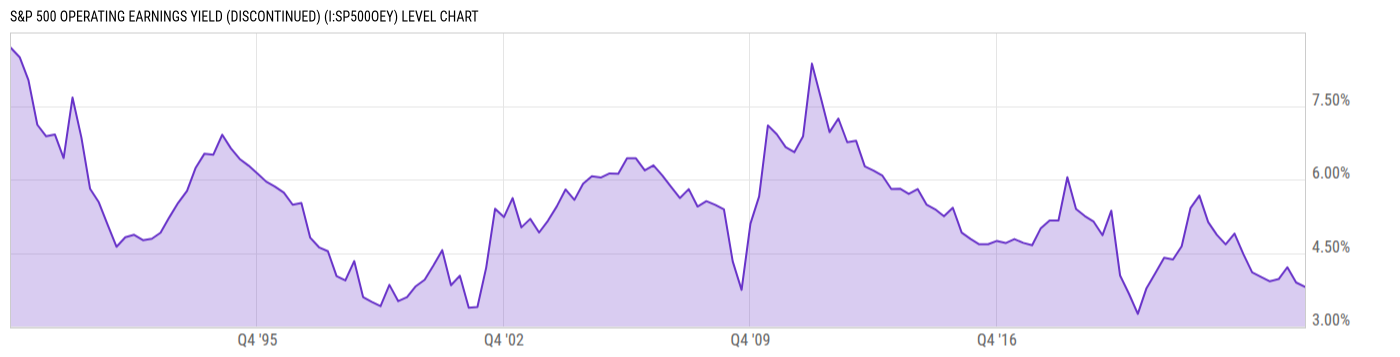
S&P 500 Operating Earnings Yield is at 3.81%, compared to 3.90% last quarter and 3.92% last year. This is lower than the long term average of 5.35%. |
|
None |
| Report | S&P 500 Earnings |
| Categories | N/A |
| Region | United States |
| Source | Standard and Poor's |
Stats
| Last Value | 3.81% |
| Latest Period | Sep 2025 |
| Last Updated | Jan 16 2026, 08:28 EST |
| Long Term Average | 5.35% |
| Average Growth Rate | -0.77% |
| Value from Last Quarter | 3.90% |
| Change from Last Quarter | -2.29% |
| Value from 1 Year Ago | 3.92% |
| Change from 1 Year Ago | -2.90% |
| Frequency | Quarterly |
| Unit | Percent |
| Adjustment | N/A |
| Download Source File |
Historical Data
| Date | Value |
|---|---|
| September 30, 2025 | 3.81% |
| June 30, 2025 | 3.90% |
| March 31, 2025 | 4.21% |
| December 31, 2024 | 3.97% |
| September 30, 2024 | 3.92% |
| June 30, 2024 | 4.01% |
| March 31, 2024 | 4.10% |
| December 31, 2023 | 4.48% |
| September 30, 2023 | 4.90% |
| June 30, 2023 | 4.68% |
| March 31, 2023 | 4.87% |
| December 31, 2022 | 5.13% |
| September 30, 2022 | 5.67% |
| June 30, 2022 | 5.42% |
| March 31, 2022 | 4.64% |
| December 31, 2021 | 4.37% |
| September 30, 2021 | 4.40% |
| June 30, 2021 | 4.08% |
| March 31, 2021 | 3.78% |
| December 31, 2020 | 3.26% |
| September 30, 2020 | 3.67% |
| June 30, 2020 | 4.04% |
| March 31, 2020 | 5.36% |
| December 31, 2019 | 4.86% |
| September 30, 2019 | 5.14% |
| Date | Value |
|---|---|
| June 30, 2019 | 5.25% |
| March 31, 2019 | 5.40% |
| December 31, 2018 | 6.05% |
| September 30, 2018 | 5.16% |
| June 30, 2018 | 5.16% |
| March 31, 2018 | 5.01% |
| December 31, 2017 | 4.66% |
| September 30, 2017 | 4.71% |
| June 30, 2017 | 4.78% |
| March 31, 2017 | 4.70% |
| December 31, 2016 | 4.75% |
| September 30, 2016 | 4.68% |
| June 30, 2016 | 4.68% |
| March 31, 2016 | 4.79% |
| December 31, 2015 | 4.91% |
| September 30, 2015 | 5.42% |
| June 30, 2015 | 5.25% |
| March 31, 2015 | 5.39% |
| December 31, 2014 | 5.49% |
| September 30, 2014 | 5.81% |
| June 30, 2014 | 5.70% |
| March 31, 2014 | 5.81% |
| December 31, 2013 | 5.81% |
| September 30, 2013 | 6.08% |
| June 30, 2013 | 6.18% |
News
Headline
Time (ET)
06/01 16:03
06/01 12:12
Basic Info
|
S&P 500 Operating Earnings Yield is at 3.81%, compared to 3.90% last quarter and 3.92% last year. This is lower than the long term average of 5.35%. |
|
None |
| Report | S&P 500 Earnings |
| Categories | N/A |
| Region | United States |
| Source | Standard and Poor's |
Stats
| Last Value | 3.81% |
| Latest Period | Sep 2025 |
| Last Updated | Jan 16 2026, 08:28 EST |
| Long Term Average | 5.35% |
| Average Growth Rate | -0.77% |
| Value from Last Quarter | 3.90% |
| Change from Last Quarter | -2.29% |
| Value from 1 Year Ago | 3.92% |
| Change from 1 Year Ago | -2.90% |
| Frequency | Quarterly |
| Unit | Percent |
| Adjustment | N/A |
| Download Source File |
Related Indicators
| S&P 500 Fundamentals |
| S&P 500 Dividend Yield (DISCONTINUED) | 1.15% |
| S&P 500 Earnings Yield (DISCONTINUED) | 3.50% |
| S&P 500 Market Cap (DISCONTINUED) | 58.44T USD |
| S&P 500 P/E Ratio (DISCONTINUED) | 28.58 |
| S&P 500 Price to Book Ratio (DISCONTINUED) | 5.265 |
| S&P 500 Shiller CAPE Ratio | 41.02 |
| SPX Put/Call Ratio | 1.34 |
| VIX | 18.92 |
| S&P 500 Returns |