

S&P 500 Earnings Per Share (DISCONTINUED) (I:SP500EPS)
Level Chart
Basic Info
|
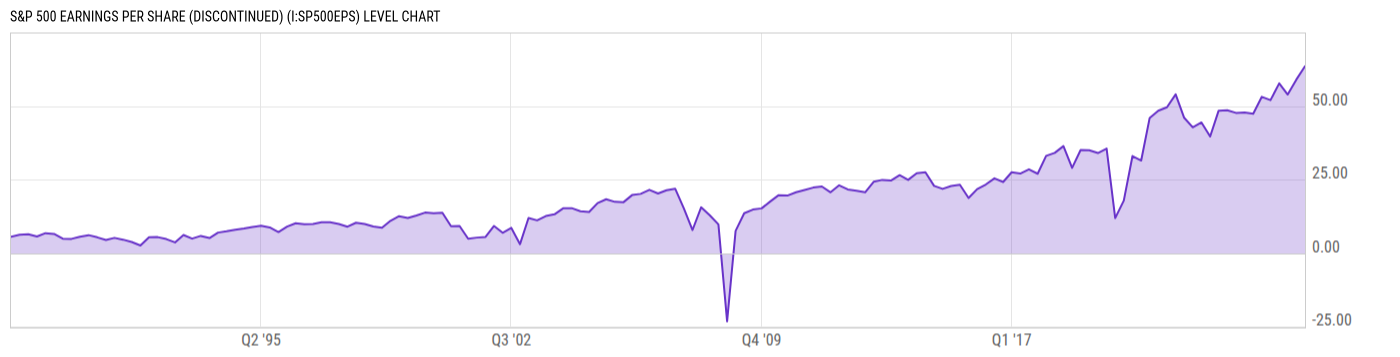
S&P 500 Earnings Per Share is at a current level of 63.52, up from 58.96 last quarter and up from 51.99 one year ago. This is a change of 7.73% from last quarter and 22.18% from one year ago. |
|
The S&P 500 Earnings Per Share measures the composite earnings per share for the S&P 500. This metric comes from Standard & Poors, and gives an idea of the overall EPS earned from the major US companies. EPS numbers experienced tumultous times during the financial crisis in 2008. S&P 500 EPS reached as low as -23.25, when many companies were not able to return a profit. |
| Report | S&P 500 Earnings |
| Categories | N/A |
| Region | United States |
| Source | Standard and Poor's |
Stats
| Last Value | 63.52 |
| Latest Period | Sep 2025 |
| Last Updated | Jan 16 2026, 08:28 EST |
| Average Growth Rate | 9.22% |
| Value from Last Quarter | 58.96 |
| Change from Last Quarter | 7.73% |
| Value from 1 Year Ago | 51.99 |
| Change from 1 Year Ago | 22.18% |
| Frequency | Quarterly |
| Unit | USD |
| Adjustment | N/A |
| Download Source File |
Historical Data
| Date | Value |
|---|---|
| September 30, 2025 | 63.52 |
| June 30, 2025 | 58.96 |
| March 31, 2025 | 53.89 |
| December 31, 2024 | 57.69 |
| September 30, 2024 | 51.99 |
| June 30, 2024 | 53.12 |
| March 31, 2024 | 47.37 |
| December 31, 2023 | 47.79 |
| September 30, 2023 | 47.65 |
| June 30, 2023 | 48.58 |
| March 31, 2023 | 48.41 |
| December 31, 2022 | 39.61 |
| September 30, 2022 | 44.41 |
| June 30, 2022 | 42.74 |
| March 31, 2022 | 45.99 |
| December 31, 2021 | 53.94 |
| September 30, 2021 | 49.59 |
| June 30, 2021 | 48.39 |
| March 31, 2021 | 45.95 |
| December 31, 2020 | 31.44 |
| September 30, 2020 | 32.98 |
| June 30, 2020 | 17.83 |
| March 31, 2020 | 11.88 |
| December 31, 2019 | 35.53 |
| September 30, 2019 | 33.99 |
| Date | Value |
|---|---|
| June 30, 2019 | 34.93 |
| March 31, 2019 | 35.02 |
| December 31, 2018 | 28.96 |
| September 30, 2018 | 36.36 |
| June 30, 2018 | 34.05 |
| March 31, 2018 | 33.02 |
| December 31, 2017 | 26.96 |
| September 30, 2017 | 28.45 |
| June 30, 2017 | 27.01 |
| March 31, 2017 | 27.46 |
| December 31, 2016 | 24.16 |
| September 30, 2016 | 25.39 |
| June 30, 2016 | 23.28 |
| March 31, 2016 | 21.72 |
| December 31, 2015 | 18.70 |
| September 30, 2015 | 23.22 |
| June 30, 2015 | 22.80 |
| March 31, 2015 | 21.81 |
| December 31, 2014 | 22.83 |
| September 30, 2014 | 27.47 |
| June 30, 2014 | 27.14 |
| March 31, 2014 | 24.87 |
| December 31, 2013 | 26.48 |
| September 30, 2013 | 24.63 |
| June 30, 2013 | 24.87 |
News
Basic Info
|
S&P 500 Earnings Per Share is at a current level of 63.52, up from 58.96 last quarter and up from 51.99 one year ago. This is a change of 7.73% from last quarter and 22.18% from one year ago. |
|
The S&P 500 Earnings Per Share measures the composite earnings per share for the S&P 500. This metric comes from Standard & Poors, and gives an idea of the overall EPS earned from the major US companies. EPS numbers experienced tumultous times during the financial crisis in 2008. S&P 500 EPS reached as low as -23.25, when many companies were not able to return a profit. |
| Report | S&P 500 Earnings |
| Categories | N/A |
| Region | United States |
| Source | Standard and Poor's |
Stats
| Last Value | 63.52 |
| Latest Period | Sep 2025 |
| Last Updated | Jan 16 2026, 08:28 EST |
| Average Growth Rate | 9.22% |
| Value from Last Quarter | 58.96 |
| Change from Last Quarter | 7.73% |
| Value from 1 Year Ago | 51.99 |
| Change from 1 Year Ago | 22.18% |
| Frequency | Quarterly |
| Unit | USD |
| Adjustment | N/A |
| Download Source File |
Related Indicators
| S&P 500 Fundamentals |
| S&P 500 Dividend Yield (DISCONTINUED) | 1.15% |
| S&P 500 Earnings Yield (DISCONTINUED) | 3.50% |
| S&P 500 Market Cap (DISCONTINUED) | 58.44T USD |
| S&P 500 P/E Ratio (DISCONTINUED) | 28.58 |
| S&P 500 Price to Book Ratio (DISCONTINUED) | 5.265 |
| S&P 500 Shiller CAPE Ratio | 41.37 |
| SPX Put/Call Ratio | 1.09 |
| VIX | 18.70 |
| S&P 500 Returns |