

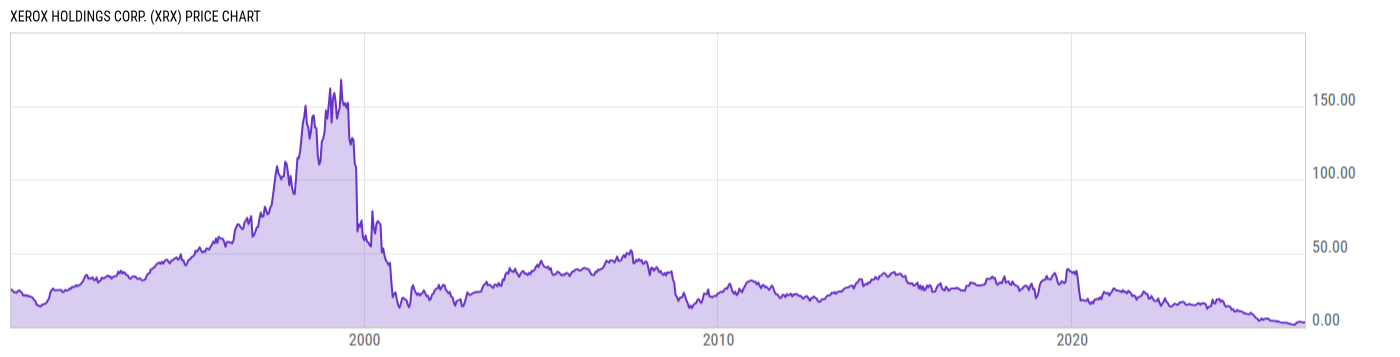
Xerox Holdings Corp. (XRX)
2.95
-0.54
(-15.47%)
USD |
NASDAQ |
Jul 31, 16:00
2.93
-0.02
(-0.68%)
After-Hours: 20:00
Price Chart
Key Stats
| Price and Performance | |
|---|---|
| Market Cap | 387.17M |
| 52 Week High (Daily) | |
| 52 Week Low (Daily) | |
| All-Time High (Daily) | |
| Year to Date Total Returns (Daily) | |
| 1 Month Total Returns (Daily) | |
| 1 Year Total Returns (Daily) | -23.86% |
| Valuation | |
| PE Ratio | -- |
| PE Ratio (Forward) | |
| PS Ratio | 0.0489 |
| Price to Book Value | 1.199 |
| EV to EBITDA | |
| Dividend | |
|---|---|
| Dividend | 0.025 |
| Dividend Yield (Forward) | |
| Financials | |
| Revenue (5 Year Growth) | |
| Revenue (Quarterly YoY Growth) | |
| EPS Diluted (5 Year Growth) | |
| EPS Diluted (Quarterly YoY Growth) | |
| Debt to Equity Ratio | 8.032 |
| Return on Equity | |
| Return on Assets | |
| Risk | |
| Beta (5Y) | |
| Max Drawdown (5Y) | 93.40% |
Profile
| Xerox Holdings Corp. is a workplace technology company, which builds and integrates software and hardware for enterprises. It operates through the Print and Other, and Financing (FITTLE) segments. The company was founded on March 11, 2019, and is headquartered in Norwalk, CT. |
| URL | http://www.xerox.com |
| Investor Relations URL | https://www.news.xerox.com/investors |
| HQ State/Province | Connecticut |
| Sector | Information Technology |
| Industry | Technology Hardware, Storage & Peripherals |
| Equity Style | Small Cap Value |
| Next Earnings Release | Oct. 29, 2026 (est.) |
| Last Earnings Release | Jul. 30, 2026 |
| Next Ex-Dividend Date | N/A |
| Last Ex-Dividend Date | Jun. 30, 2026 |