

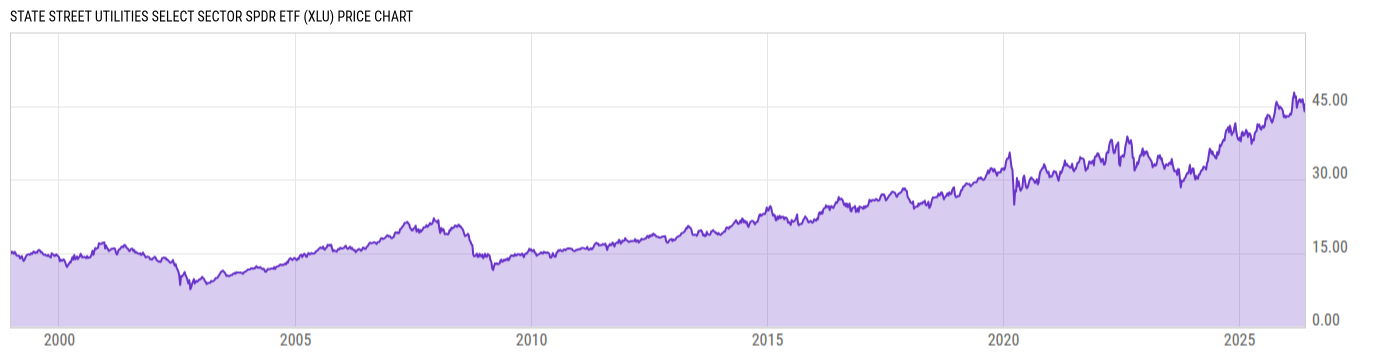
State Street Utilities Select Sector SPDR ETF (XLU)
43.50
-0.84
(-1.91%)
USD |
NYSEARCA |
Jun 08, 16:00
43.57
+0.06
(+0.15%)
After-Hours: 18:11
Price Chart
Key Stats
| Net Expense Ratio | Discount or Premium to NAV | Total Assets Under Management | 30-Day Average Daily Volume |
|---|---|---|---|
| 0.08% | 0.01% | 22.55B | 20.76M |
| Weighted Average Dividend Yield | Turnover Ratio (Generic) | 1 Year Fund Level Flows | Max Drawdown (Since Inception) |
| 2.54% | 2.00% | 1.346B |
Basic Info
| Investment Strategy | |
| The Fund seeks to provide investment results that, before expenses, correspond generally to the price and yield performance of the Utilities Select Sector Index. Under normal market conditions, the fund generally invests substantially all, but at least 95%, of its total assets in the securities comprising the Index. |
| General | |
| Security Type | Exchange-Traded Fund |
| Equity Style | Multi Cap Value |
| Broad Asset Class | Sector Equity |
| Broad Category | Equity |
| Global Peer Group | Equity Sector Utilities |
| Peer Group | Utility Funds |
| Global Macro | Equity Industry Sector |
| US Macro | Sector Equity Funds |
| YCharts Categorization | -- |
| YCharts Benchmark | -- |
| Prospectus Objective | Utility Funds |
| Fund Owner Firm Name | State Street Investment Management |
| Broad Asset Class Benchmark Index | |
| ^MSWNTR | 100.0% |
Performance Versus Peer Group
Annual Total Returns Versus Peers
As of June 08, 2026.
Asset Allocation
As of April 30, 2026.
| Type | % Net |
|---|---|
| Cash | 0.13% |
| Stock | 99.74% |
| Bond | 0.11% |
| Convertible | 0.00% |
| Preferred | 0.00% |
| Other | 0.01% |
Basic Info
| Investment Strategy | |
| The Fund seeks to provide investment results that, before expenses, correspond generally to the price and yield performance of the Utilities Select Sector Index. Under normal market conditions, the fund generally invests substantially all, but at least 95%, of its total assets in the securities comprising the Index. |
| General | |
| Security Type | Exchange-Traded Fund |
| Equity Style | Multi Cap Value |
| Broad Asset Class | Sector Equity |
| Broad Category | Equity |
| Global Peer Group | Equity Sector Utilities |
| Peer Group | Utility Funds |
| Global Macro | Equity Industry Sector |
| US Macro | Sector Equity Funds |
| YCharts Categorization | -- |
| YCharts Benchmark | -- |
| Prospectus Objective | Utility Funds |
| Fund Owner Firm Name | State Street Investment Management |
| Broad Asset Class Benchmark Index | |
| ^MSWNTR | 100.0% |