

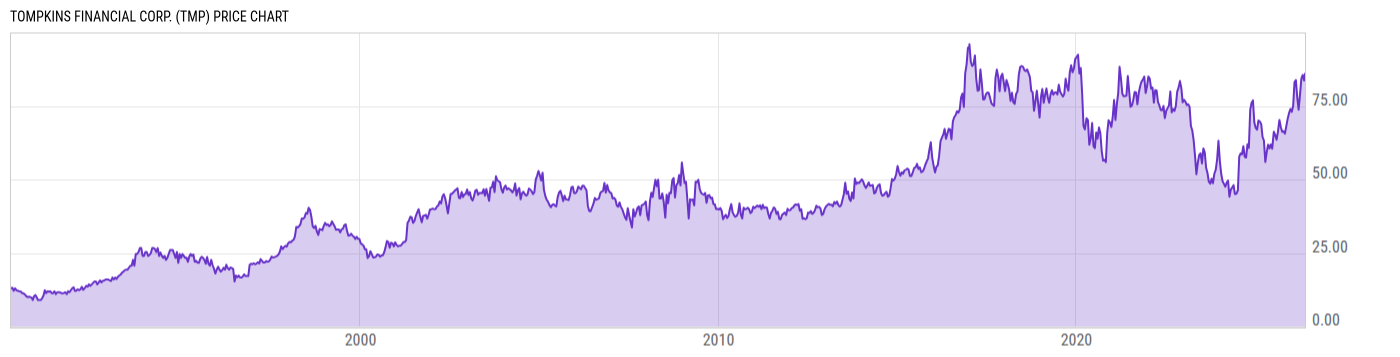
Tompkins Financial Corp. (TMP)
87.10
+0.38
(+0.44%)
USD |
NYAM |
Jun 05, 16:00
87.10
0.00 (0.00%)
After-Hours: 20:00
Price Chart
Key Stats
| Price and Performance | |
|---|---|
| Market Cap | 1.248B |
| 52 Week High (Daily) | |
| 52 Week Low (Daily) | |
| All-Time High (Daily) | |
| Year to Date Total Returns (Daily) | |
| 1 Month Total Returns (Daily) | |
| 1 Year Total Returns (Daily) | 47.87% |
| Valuation | |
| PE Ratio | 7.463 |
| PE Ratio (Forward) | |
| PS Ratio | 3.197 |
| Price to Book Value | 1.319 |
| EV to EBITDA | |
| Dividend | |
|---|---|
| Dividend | 0.67 |
| Dividend Yield (Forward) | |
| Financials | |
| Revenue (5 Year Growth) | |
| Revenue (Quarterly YoY Growth) | |
| EPS Diluted (5 Year Growth) | |
| EPS Diluted (Quarterly YoY Growth) | |
| Debt to Equity Ratio | 0.5995 |
| Return on Equity | |
| Return on Assets | |
| Risk | |
| Beta (5Y) | |
| Max Drawdown (5Y) | 47.80% |
Profile
| Tompkins Financial Corp. engages in the provision of financial services. It operates through the following segments: Banking, Insurance, and Wealth Management. The Banking segment consists of its banking subsidiaries, including Tompkins Trust Co., The Bank of Castile, Mahopac Bank, and VIST Bank. The Insurance segment offers property and casualty insurance services, and employee benefits consulting. The Wealth Management segment consists of a comprehensive suite of financial services to customers, including trust and estate services, investment management, and insurance. The company was founded in 1995 and is headquartered in Ithaca, NY. |
| URL | http://www.tompkinsfinancial.com |
| Investor Relations URL | https://www.tompkinsfinancial.com/investor-relations/faqs |
| HQ State/Province | New York |
| Sector | Financials |
| Industry | Banks |
| Next Earnings Release | Jul. 24, 2026 (est.) |
| Last Earnings Release | Apr. 24, 2026 |
| Next Ex-Dividend Date | N/A |
| Last Ex-Dividend Date | May. 08, 2026 |