

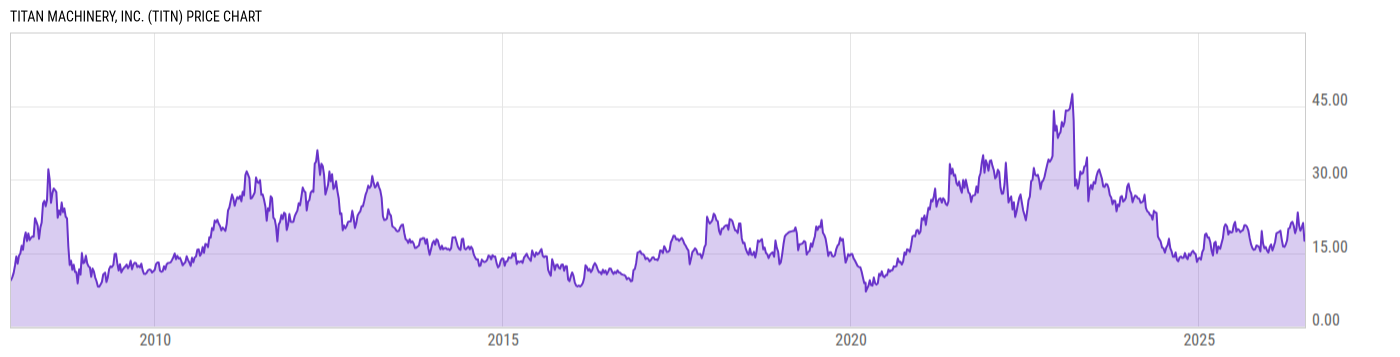
Titan Machinery, Inc. (TITN)
18.27
+0.31
(+1.73%)
USD |
NASDAQ |
Jul 10, 16:00
18.28
+0.01
(+0.05%)
After-Hours: 20:00
Price Chart
Key Stats
| Price and Performance | |
|---|---|
| Market Cap | 425.86M |
| 52 Week High (Daily) | |
| 52 Week Low (Daily) | |
| All-Time High (Daily) | |
| Year to Date Total Returns (Daily) | |
| 1 Month Total Returns (Daily) | |
| 1 Year Total Returns (Daily) | -10.53% |
| Valuation | |
| PE Ratio | -- |
| PE Ratio (Forward) | |
| PS Ratio | 0.1768 |
| Price to Book Value | 0.7518 |
| EV to EBITDA | |
| Dividend | |
|---|---|
| Dividend | -- |
| Dividend Yield (Forward) | |
| Financials | |
| Revenue (5 Year Growth) | |
| Revenue (Quarterly YoY Growth) | |
| EPS Diluted (5 Year Growth) | |
| EPS Diluted (Quarterly YoY Growth) | |
| Debt to Equity Ratio | 1.515 |
| Return on Equity | |
| Return on Assets | |
| Risk | |
| Beta (5Y) | |
| Max Drawdown (5Y) | 72.86% |
Profile
| Titan Machinery, Inc. engages in the management of agricultural and construction equipment stores. It operates through the following segments: Agriculture, Construction, Europe, and Australian. The Agriculture segment sells services and rents machinery and related parts and attachments, for uses from large-scale farming to home and garden use in North America. The Construction segment focuses on machinery and related parts and attachments, for uses from heavy construction to light industrial machinery. The Europe segment manages ancillary sales and services related to agricultural activities and products in Eastern Europe and Germany. The Australian segments offer products such as equipment transportation, GPS signal subscriptions, and finance and insurance products in Southeastern Australia. The company was founded by David Joseph Meyer in 1980 and is headquartered in West Fargo, ND. |
| URL | http://www.titanmachinery.com |
| Investor Relations URL | https://ir.titanmachinery.com/ |
| HQ State/Province | North Dakota |
| Sector | Industrials |
| Industry | Trading Companies & Distributors |
| Equity Style | Small Cap Core |
| Next Earnings Release | Aug. 27, 2026 (est.) |
| Last Earnings Release | Jun. 09, 2026 |
| Next Ex-Dividend Date | N/A |
| Last Ex-Dividend Date | N/A |