

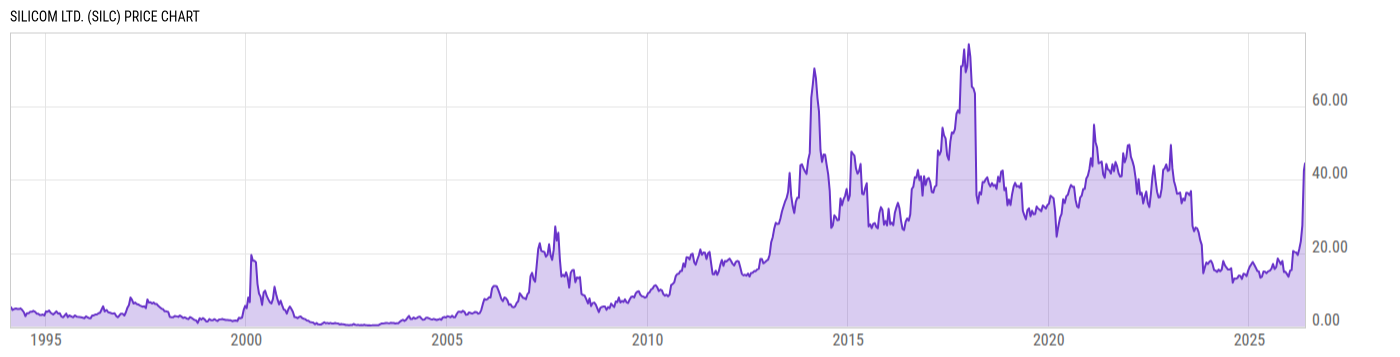
Silicom Ltd. (SILC)
45.82
-2.08
(-4.34%)
USD |
NASDAQ |
Jun 16, 15:50
Price Chart
Key Stats
| Price and Performance | |
|---|---|
| Market Cap | 261.02M |
| 52 Week High (Daily) | |
| 52 Week Low (Daily) | |
| All-Time High (Daily) | |
| Year to Date Total Returns (Daily) | |
| 1 Month Total Returns (Daily) | |
| 1 Year Total Returns (Daily) | 222.3% |
| Valuation | |
| PE Ratio | -- |
| PE Ratio (Forward) | |
| PS Ratio | 3.919 |
| Price to Book Value | 2.250 |
| EV to EBITDA | |
| Dividend | |
|---|---|
| Dividend | -- |
| Dividend Yield (Forward) | |
| Financials | |
| Revenue (5 Year Growth) | |
| Revenue (Quarterly YoY Growth) | |
| EPS Diluted (5 Year Growth) | |
| EPS Diluted (Quarterly YoY Growth) | |
| Debt to Equity Ratio | 0.0569 |
| Return on Equity | |
| Return on Assets | |
| Risk | |
| Beta (5Y) | |
| Max Drawdown (5Y) | 78.70% |
Profile
| Silicom Ltd. engages in the provision of networking and data infrastructure solutions. Its products include server adapters, smart cards, bypass switches, and intelligent bypass switches. The firm operates through the following geographical segments: USA, North America, Israel, Europe, and Asia Pacific. The company was founded by Avi Eizenman, Yehuda Zisapel, and Zohar Zisapel in 1987 and is headquartered in Kfar Sava, Israel. |
| URL | http://www.silicom.co.il |
| Investor Relations URL | https://www.silicom-usa.com/webcasts/ |
| HQ State/Province | HaMerkaz |
| Sector | Information Technology |
| Industry | Communications Equipment |
| Equity Style | Small Cap Value |
| Next Earnings Release | Jul. 30, 2026 (est.) |
| Last Earnings Release | Apr. 30, 2026 |
| Next Ex-Dividend Date | N/A |
| Last Ex-Dividend Date | Mar. 23, 2017 |