

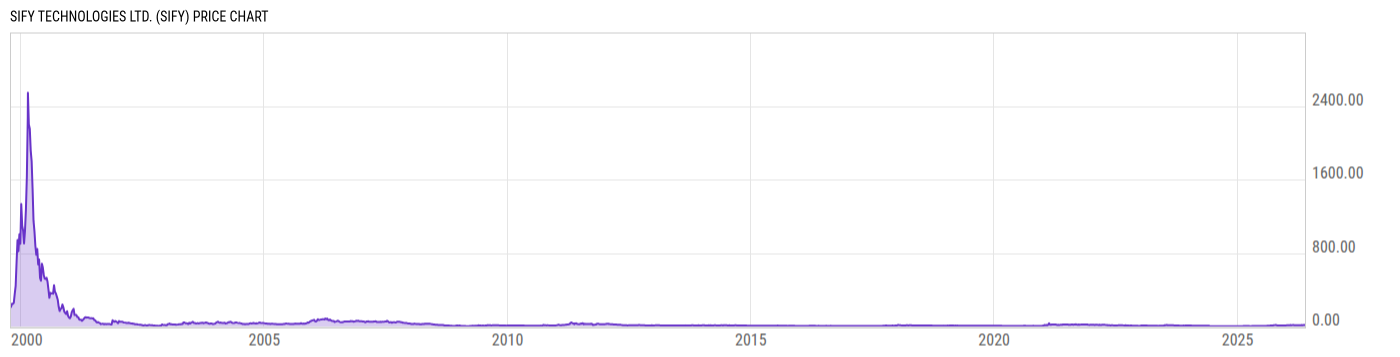
Sify Technologies Ltd. (SIFY)
15.79
+1.23
(+8.45%)
USD |
NASDAQ |
Jun 08, 16:00
15.74
-0.05
(-0.32%)
After-Hours: 20:00
Price Chart
Key Stats
| Price and Performance | |
|---|---|
| Market Cap | 1.140B |
| 52 Week High (Daily) | |
| 52 Week Low (Daily) | |
| All-Time High (Daily) | |
| Year to Date Total Returns (Daily) | |
| 1 Month Total Returns (Daily) | |
| 1 Year Total Returns (Daily) | 218.3% |
| Valuation | |
| PE Ratio | -- |
| PE Ratio (Forward) | |
| PS Ratio | -- |
| Price to Book Value | 6.283 |
| EV to EBITDA | |
| Dividend | |
|---|---|
| Dividend | -- |
| Dividend Yield (Forward) | |
| Financials | |
| Revenue (5 Year Growth) | |
| Revenue (Quarterly YoY Growth) | |
| EPS Diluted (5 Year Growth) | |
| EPS Diluted (Quarterly YoY Growth) | |
| Debt to Equity Ratio | -- |
| Return on Equity | |
| Return on Assets | |
| Risk | |
| Beta (5Y) | |
| Max Drawdown (5Y) | 94.34% |
Profile
| Sify Technologies Ltd. engages in the provision of integrated Internet, network, and electronic commerce services in India. It operates through the following segments: Network-centric Services, and Data Center-centric Information Technology Services. The Network-centric Services segment includes domestic data, international data wholesale voice, and network managed services. The Data Center-centric Information Technology Services segment comprises of data center; cloud and managed; technology integration, and applications integration services. The company was founded on December 12, 1995 and is headquartered in Chennai, India. |
| URL | http://sifytechnologies.com |
| Investor Relations URL | https://www.sifytechnologies.com/investors/ |
| HQ State/Province | Tamil Nadu |
| Sector | Communication Services |
| Industry | Diversified Telecommunication Services |
| Next Earnings Release | Jul. 17, 2026 (est.) |
| Last Earnings Release | Apr. 13, 2026 |
| Next Ex-Dividend Date | N/A |
| Last Ex-Dividend Date | May. 24, 2019 |