

Shore Bancshares Inc (SHBI)
Company Valuation Ratios
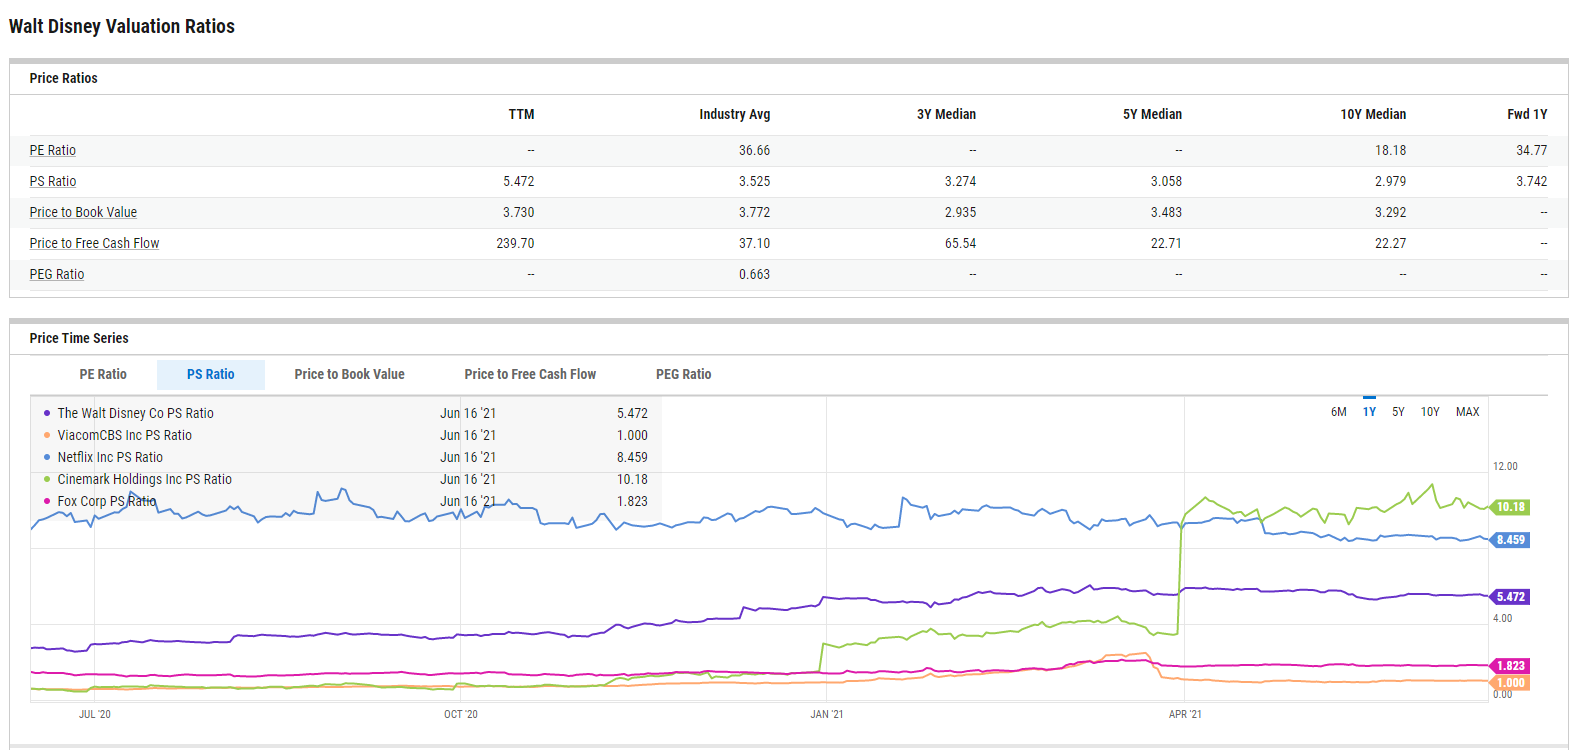
Go beyond the stock price to figure out what a company is really worth. The valuation page provides key Price and Enterprise Valuation metrics, compared against historical and industry averages.
Take a Deeper Look
A simple price chart only tells a small part of the story. Dig in deeper by evaluating valuation ratios against historical medians, industry averages, and even forward estimates. Time series data tables show 10 years of history, and interactive charts let you visualize key metrics over adjustable timeframes.
Find a Great Deal
Evaluating companies based on historic multiples can be a way to identify investment opportunities that are underpriced. While past performance is no promise of future returns, these values can be used as a signal to dig deeper. If a company is valued differently today than it was in the past, there may be a good reason. If you can’t find one, you may have found a good deal. The company valuation pages are available with a subscription. To learn more and see it in action, please contact a sales representative today.
QUESTIONS?
- Email: support@ycharts.com
- Call: (866) 965-7552
READY TO GET STARTED?
Unlock My AccessAccess the Valuation & Performance Pages Now
Unlock access to the Valuation & Performance Pages by registering below. No credit card required.
Unlock My AccessQUESTIONS?
- Email: support@ycharts.com
- Call: (866) 965-7552