

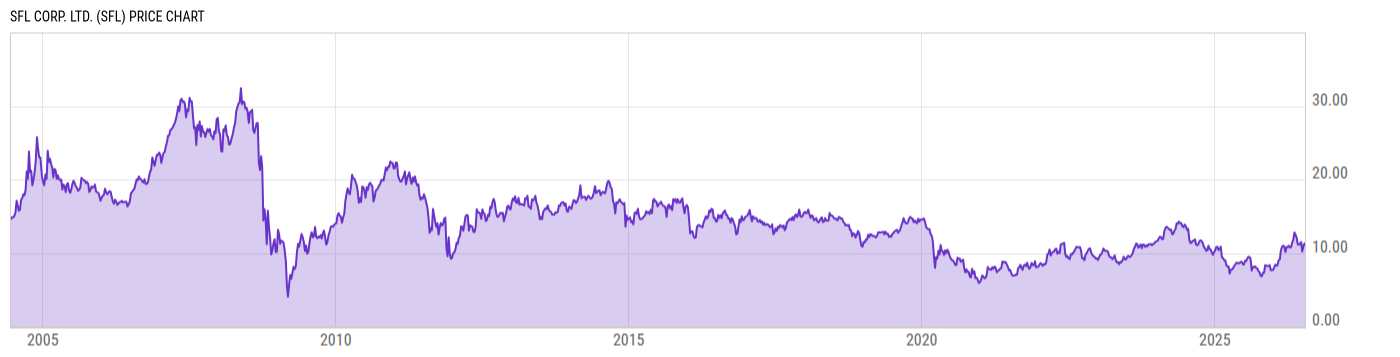
SFL Corp. Ltd. (SFL)
11.10
-0.18
(-1.64%)
USD |
NYSE |
Jul 17, 16:00
11.10
0.00 (0.00%)
After-Hours: 20:00
Price Chart
Key Stats
| Price and Performance | |
|---|---|
| Market Cap | 1.608B |
| 52 Week High (Daily) | |
| 52 Week Low (Daily) | |
| All-Time High (Daily) | |
| Year to Date Total Returns (Daily) | |
| 1 Month Total Returns (Daily) | |
| 1 Year Total Returns (Daily) | 38.19% |
| Valuation | |
| PE Ratio | 48.26 |
| PE Ratio (Forward) | |
| PS Ratio | 2.139 |
| Price to Book Value | 1.666 |
| EV to EBITDA | |
| Dividend | |
|---|---|
| Dividend | 0.22 |
| Dividend Yield (Forward) | |
| Financials | |
| Revenue (5 Year Growth) | |
| Revenue (Quarterly YoY Growth) | |
| EPS Diluted (5 Year Growth) | |
| EPS Diluted (Quarterly YoY Growth) | |
| Debt to Equity Ratio | 2.593 |
| Return on Equity | |
| Return on Assets | |
| Risk | |
| Beta (5Y) | |
| Max Drawdown (5Y) | 47.61% |
Profile
| SFL Corp. Ltd. engages in the provision of ownership and operation of vessels and offshore related assets. The firm is also involved in the charter, purchase, and sale of assets. It operates through subsidiaries located in Bermuda, Cyprus, Malta, Liberia, Norway, the United Kingdom, and the Marshall Islands. The company was founded on October 10, 2003 and is headquartered in Hamilton, Bermuda. |
| URL | http://www.sflcorp.com |
| Investor Relations URL | https://www.sflcorp.com/financials |
| HQ State/Province | Hamilton |
| Sector | Energy |
| Industry | Oil, Gas & Consumable Fuels |
| Equity Style | Small Cap Value |
| Next Earnings Release | Aug. 18, 2026 (est.) |
| Last Earnings Release | May. 12, 2026 |
| Next Ex-Dividend Date | N/A |
| Last Ex-Dividend Date | May. 27, 2026 |