

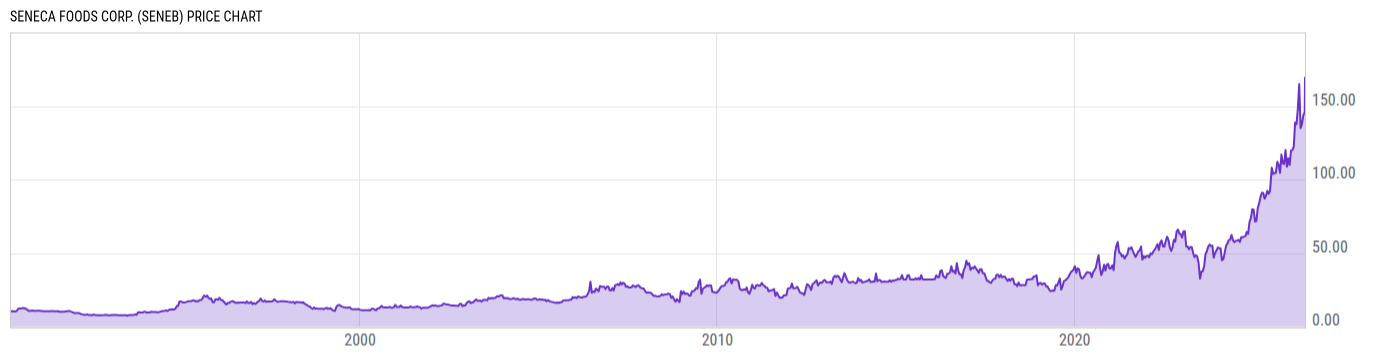
Seneca Foods Corp. (SENEB)
145.75
0.00 (0.00%)
USD |
NASDAQ |
Jun 08, 16:00
Price Chart
Key Stats
| Price and Performance | |
|---|---|
| Market Cap | 994.26M |
| 52 Week High (Daily) | |
| 52 Week Low (Daily) | |
| All-Time High (Daily) | |
| Year to Date Total Returns (Daily) | |
| 1 Month Total Returns (Daily) | |
| 1 Year Total Returns (Daily) | 61.60% |
| Valuation | |
| PE Ratio | 11.22 |
| PE Ratio (Forward) | |
| PS Ratio | 0.6259 |
| Price to Book Value | 1.393 |
| EV to EBITDA | |
| Dividend | |
|---|---|
| Dividend | -- |
| Dividend Yield (Forward) | |
| Financials | |
| Revenue (5 Year Growth) | |
| Revenue (Quarterly YoY Growth) | |
| EPS Diluted (5 Year Growth) | |
| EPS Diluted (Quarterly YoY Growth) | |
| Debt to Equity Ratio | 0.4121 |
| Return on Equity | |
| Return on Assets | |
| Risk | |
| Beta (5Y) | |
| Max Drawdown (5Y) | 53.42% |
Profile
| Seneca Foods Corp. engages in the processing and sale of packaged fruits and vegetables. It offers canned, frozen and bottled produce, and snack chips products. It operates through the following business segments: Canned Vegetables, Frozen Vegetables, Fruit Products, Snack Products, and Other. The company was founded by Arthur S. Wolcott in 1949 and is headquartered in Fairport, NY. |
| URL | http://www.senecafoods.com |
| Investor Relations URL | https://www.senecafoods.com/investors |
| HQ State/Province | New York |
| Sector | Consumer Staples |
| Industry | Food Products |
| Next Earnings Release | Jun. 11, 2026 (est.) |
| Last Earnings Release | Feb. 05, 2026 |
| Next Ex-Dividend Date | N/A |
| Last Ex-Dividend Date | N/A |