

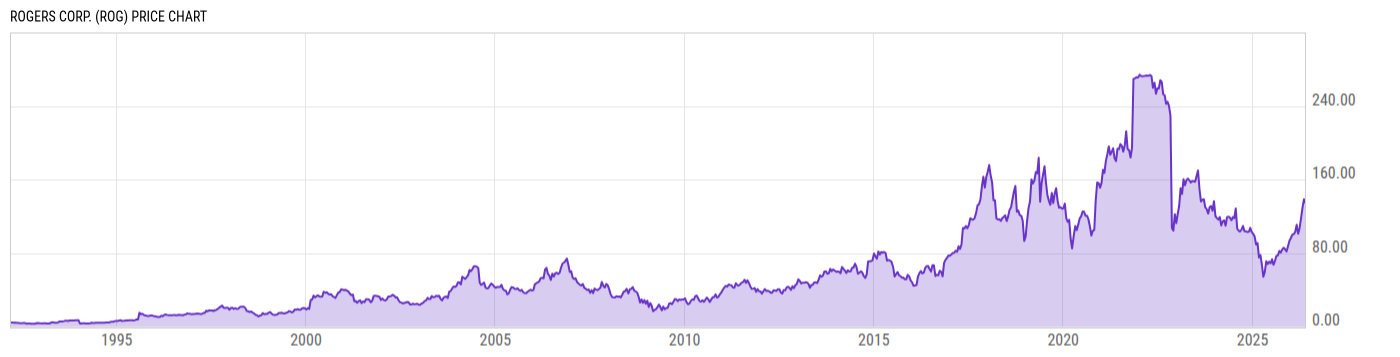
Rogers Corp. (ROG)
137.96
-7.82
(-5.36%)
USD |
NYSE |
Jun 05, 16:00
137.96
0.00 (0.00%)
After-Hours: 20:00
Price Chart
Key Stats
| Price and Performance | |
|---|---|
| Market Cap | 2.456B |
| 52 Week High (Daily) | |
| 52 Week Low (Daily) | |
| All-Time High (Daily) | |
| Year to Date Total Returns (Daily) | |
| 1 Month Total Returns (Daily) | |
| 1 Year Total Returns (Daily) | 116.5% |
| Valuation | |
| PE Ratio | -- |
| PE Ratio (Forward) | |
| PS Ratio | 3.042 |
| Price to Book Value | 2.059 |
| EV to EBITDA | |
| Dividend | |
|---|---|
| Dividend | -- |
| Dividend Yield (Forward) | |
| Financials | |
| Revenue (5 Year Growth) | |
| Revenue (Quarterly YoY Growth) | |
| EPS Diluted (5 Year Growth) | |
| EPS Diluted (Quarterly YoY Growth) | |
| Debt to Equity Ratio | 0.025 |
| Return on Equity | |
| Return on Assets | |
| Risk | |
| Beta (5Y) | |
| Max Drawdown (5Y) | 80.77% |
Profile
| Rogers Corp. engages in the design, development, manufacture, and sale of engineered materials and components for mission critical applications. It operates through the following segments: Advanced Electronics Solutions (AES), Elastomeric Material Solutions (EMS), and Other. The AES segment focuses on the designs, development, manufacture, and sale of circuit materials, ceramic substrate materials, busbars and cooling solutions for applications in electric and hybrid electric vehicles, wireless infrastructure, automotive, telematics and thermal solutions, aerospace and defense, mass transit, clean energy, connected devices, and wired infrastructures. The EMS segment is involved in the designs, development, manufacture, and sale of engineered material solutions for a wide variety of applications and markets. The Other segment consists of elastomer components for applications in the general industrial market, as well as elastomer floats for level sensing in fuel tanks, motors, and storage tanks applications in the general industrial and automotive markets. The company was founded by Peter Rogers in 1832 and is headquartered in Chandler, AZ. |
| URL | http://www.rogerscorp.com |
| Investor Relations URL | https://www.rogerscorp.com/Investors |
| HQ State/Province | Arizona |
| Sector | Information Technology |
| Industry | Electronic Equipment, Instruments & Components |
| Next Earnings Release | Jul. 30, 2026 (est.) |
| Last Earnings Release | Apr. 28, 2026 |
| Next Ex-Dividend Date | N/A |
| Last Ex-Dividend Date | Jan. 09, 1992 |