

Dr. Reddy's Laboratories Ltd. (RDY)
12.70
-0.06
(-0.51%)
USD |
NYSE |
Jul 16, 16:00
12.70
0.00 (0.00%)
After-Hours: 20:00
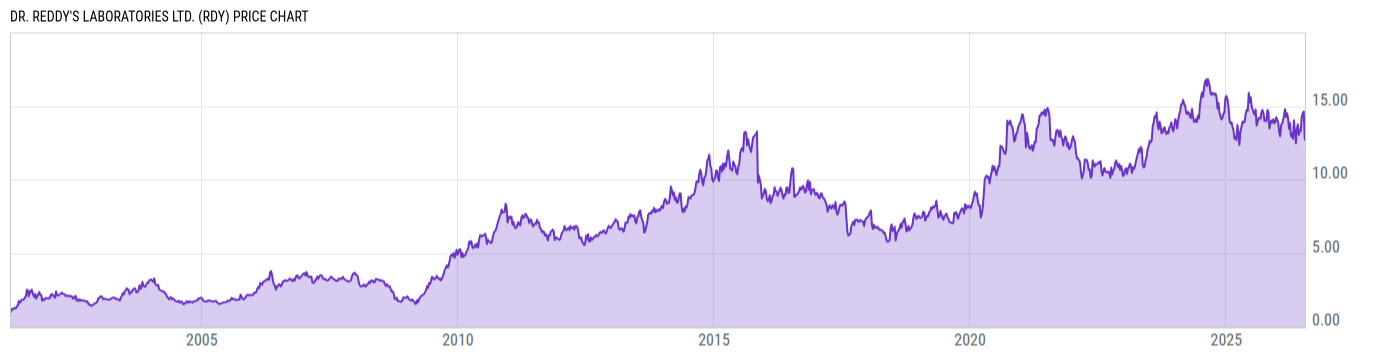
Price Chart
Key Stats
| Price and Performance | |
|---|---|
| Market Cap | 10.58B |
| 52 Week High (Daily) | |
| 52 Week Low (Daily) | |
| All-Time High (Daily) | |
| Year to Date Total Returns (Daily) | |
| 1 Month Total Returns (Daily) | |
| 1 Year Total Returns (Daily) | -11.55% |
| Valuation | |
| PE Ratio | 21.63 |
| PE Ratio (Forward) | |
| PS Ratio | 2.785 |
| Price to Book Value | 2.553 |
| EV to EBITDA | |
| Dividend | |
|---|---|
| Dividend | 0.0834 |
| Dividend Yield (Forward) | |
| Financials | |
| Revenue (5 Year Growth) | |
| Revenue (Quarterly YoY Growth) | |
| EPS Diluted (5 Year Growth) | |
| EPS Diluted (Quarterly YoY Growth) | |
| Debt to Equity Ratio | 0.2051 |
| Return on Equity | |
| Return on Assets | |
| Risk | |
| Beta (5Y) | |
| Max Drawdown (5Y) | 35.89% |
Profile
| Dr. Reddy's Laboratories Ltd. engages in the manufacture and marketing of pharmaceutical products. It operates through the following segments: Global Generics, Pharmaceutical Services and Active Ingredients, and Others. The Global Generics segment refers to the manufacturing and marketing of prescription and over-the-counter finished pharmaceutical products ready for consumption by the patient, marketed under a brand name or as generic finished dosages with therapeutic equivalence to branded formulations. The Pharmaceutical Services and Active Ingredients segment focuses on manufacturing and marketing of active pharmaceutical ingredients and intermediates, also known as API, which are the principal ingredients for finished pharmaceutical products. The Others segment includes the operations of the subsidiary of the company. The company was founded by Kallam Anji Reddy on February 24, 1984 and is headquartered in Hyderabad, India. |
| URL | http://www.drreddys.com |
| Investor Relations URL | https://www.drreddys.com/investor |
| HQ State/Province | Telangana |
| Sector | Health Care |
| Industry | Pharmaceuticals |
| Equity Style | Small Cap Core |
| Next Earnings Release | Jul. 22, 2026 |
| Last Earnings Release | May. 12, 2026 |
| Next Ex-Dividend Date | Jul. 24, 2026 |
| Last Ex-Dividend Date | Jul. 25, 2025 |