

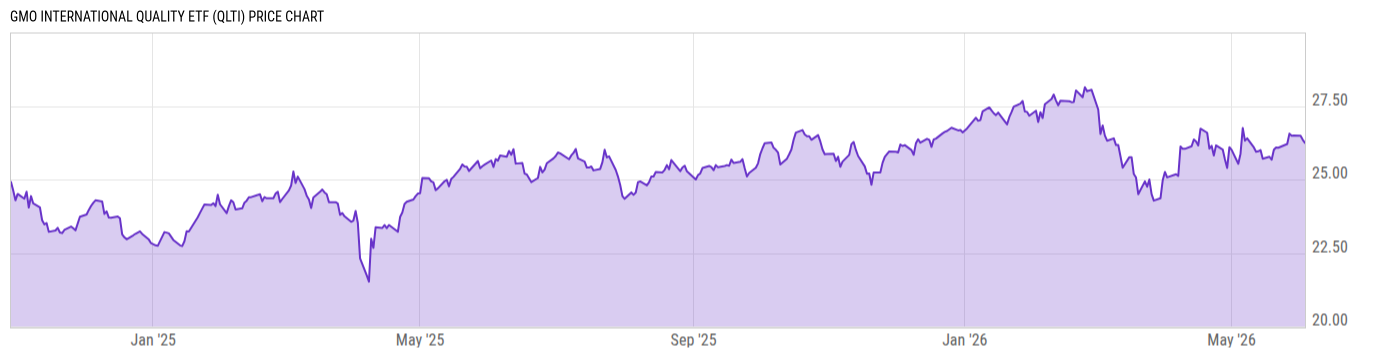
GMO International Quality ETF (QLTI)
26.24
-0.11
(-0.42%)
USD |
NYSEARCA |
Jun 03, 16:00
26.24
0.00 (0.00%)
After-Hours: 19:59
Price Chart
Key Stats
| Net Expense Ratio | Discount or Premium to NAV | Total Assets Under Management | 30-Day Average Daily Volume |
|---|---|---|---|
| 0.60% | 0.04% | 283.15M | 31173.00 |
| Weighted Average Dividend Yield | Turnover Ratio (Generic) | 1 Year Fund Level Flows | Max Drawdown (Since Inception) |
| 2.40% | 9.00% | 234.90M |
Basic Info
| Investment Strategy | |
| The Fund seeks total return. Investing primarily in non-US equities that the adviser believes to be of high quality, a company that has an established business that will deliver a high level of return on past investments and that will use cash flows to make investments with the potential for a high return on capital. |
| General | |
| Security Type | Exchange-Traded Fund |
| Equity Style | Large Cap Growth |
| Broad Asset Class | International Equity |
| Broad Category | Equity |
| Global Peer Group | Equity Global ex US |
| Peer Group | International Large-Cap Growth |
| Global Macro | Equity Global |
| US Macro | Developed International Markets Funds |
| YCharts Categorization | -- |
| YCharts Benchmark | -- |
| Prospectus Objective | International Funds |
| Fund Owner Firm Name | GMO |
| Broad Asset Class Benchmark Index | |
| ^MSACXUSNTR | 100.0% |
Performance Versus Peer Group
Annual Total Returns Versus Peers
As of June 03, 2026.
Asset Allocation
As of April 30, 2026.
| Type | % Net |
|---|---|
| Cash | -0.01% |
| Stock | 98.99% |
| Bond | 0.92% |
| Convertible | 0.00% |
| Preferred | 0.00% |
| Other | 0.10% |
Basic Info
| Investment Strategy | |
| The Fund seeks total return. Investing primarily in non-US equities that the adviser believes to be of high quality, a company that has an established business that will deliver a high level of return on past investments and that will use cash flows to make investments with the potential for a high return on capital. |
| General | |
| Security Type | Exchange-Traded Fund |
| Equity Style | Large Cap Growth |
| Broad Asset Class | International Equity |
| Broad Category | Equity |
| Global Peer Group | Equity Global ex US |
| Peer Group | International Large-Cap Growth |
| Global Macro | Equity Global |
| US Macro | Developed International Markets Funds |
| YCharts Categorization | -- |
| YCharts Benchmark | -- |
| Prospectus Objective | International Funds |
| Fund Owner Firm Name | GMO |
| Broad Asset Class Benchmark Index | |
| ^MSACXUSNTR | 100.0% |