

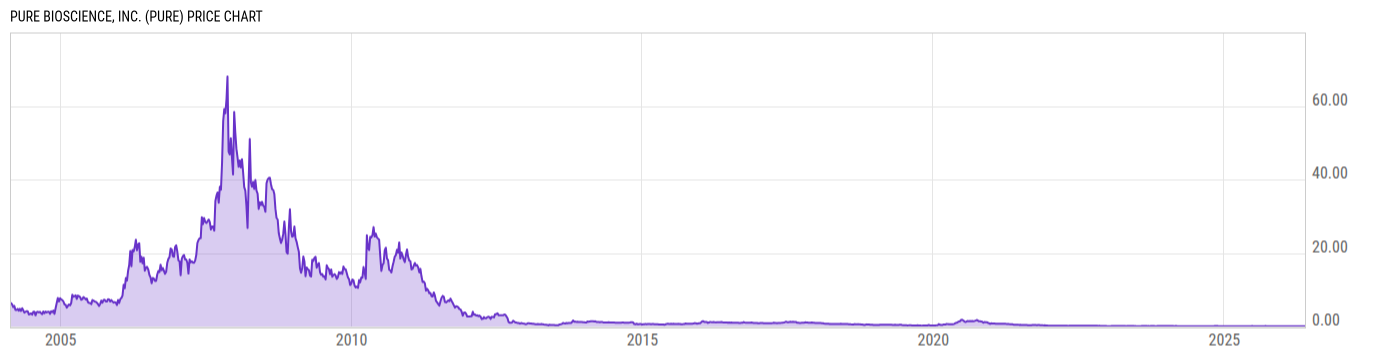
PURE Bioscience, Inc. (PURE)
0.067
+0.01
(+8.94%)
USD |
OTCM |
Jun 17, 16:00
Price Chart
Key Stats
| Price and Performance | |
|---|---|
| Market Cap | 8.711M |
| 52 Week High (Daily) | |
| 52 Week Low (Daily) | |
| All-Time High (Daily) | |
| Year to Date Total Returns (Daily) | |
| 1 Month Total Returns (Daily) | |
| 1 Year Total Returns (Daily) | -21.36% |
| Valuation | |
| PE Ratio | -- |
| PE Ratio (Forward) | |
| PS Ratio | 3.088 |
| Price to Book Value | -- |
| EV to EBITDA | |
| Dividend | |
|---|---|
| Dividend | -- |
| Dividend Yield (Forward) | |
| Financials | |
| Revenue (5 Year Growth) | |
| Revenue (Quarterly YoY Growth) | |
| EPS Diluted (5 Year Growth) | |
| EPS Diluted (Quarterly YoY Growth) | |
| Debt to Equity Ratio | -1.113 |
| Return on Equity | |
| Return on Assets | |
| Risk | |
| Beta (5Y) | |
| Max Drawdown (5Y) | 97.60% |
Profile
| PURE Bioscience, Inc. engages in the discovery, development, and commercialization of proprietary antimicrobial products for pathogen and hygienic control. It offers silver dihydrogen citrate-based disinfecting and sanitizing products. The company was founded by Michael L. Krall on August 24, 1992 and is headquartered in El Cajon, CA. |
| URL | http://www.purebio.com |
| Investor Relations URL | N/A |
| HQ State/Province | California |
| Sector | Consumer Staples |
| Industry | Household Products |
| Equity Style | Small Cap Core |
| Next Earnings Release | N/A |
| Last Earnings Release | Jun. 13, 2024 |
| Next Ex-Dividend Date | N/A |
| Last Ex-Dividend Date | N/A |