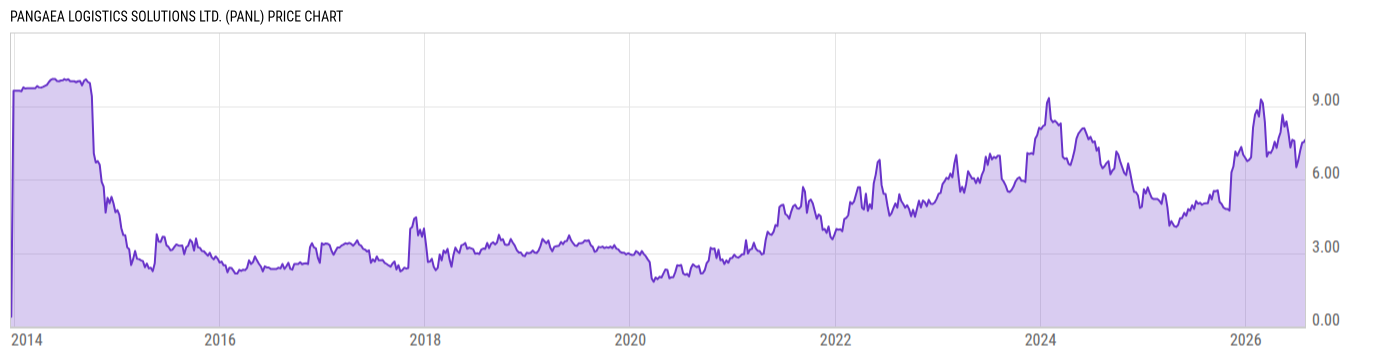
News
| Feb 10 | The Magic Formula for These Electrical Companies Fool |
| Feb 09 | Moving higher since breaking out of this descending wedge. Another 10pts til measured move completes $PANL http://chart.ly/vm2wx4q by JFDI |
| Feb 08 | RT @OptionsHawk $BRCM $CAVM $JNPR $PANL - some big names presenting at Stifel Tech Conf. today by lillianwong |
| Feb 08 | Notable Put Options Activity in Universal Display Benzinga |
| Feb 08 | $PANL http://stks.co/2J4P Daily: added to my swing long watch list. Like it above 48.10. Earnings 02/28/2012. (No pos.) by jackdamn |
| Feb 08 | $panl looks good to b/o holding by MomentumPartnersLLC |
| Feb 08 | $panl looks like it want to b/o $48 by MomentumPartnersLLC |
| Feb 08 | potential action point: $PANL http://chart.ly/hug68ht by sssc |
| Feb 07 | What the OLED Players Are Doing Now Fool |
| Feb 07 | Anyone else like $PANL short here? by Rossco1 |
| Feb 02 | Cree and Universal Display Face Margin Pressure as LED Prices Deteriorate Marketwire |
| Jan 31 | 3 Disruptive Technologies for Your Portfolio |
Profile
Exchange: NASDAQGM Sector: Technology Industry: Computer Peripherals
Universal Display Corp. is engaged in the research, development and commercialization of organic light emitting diode, or OLED, technologies and materials to display and lighting industries. The company provides customized solutions to its clients and partners through technology transfer, collaborative technology development and on-site training. The company had entered into more than 30 business agreements with leading manufacturers in Japan, Korea, Taiwan, China, Europe and the U.S. including with companies such as Chi Mei EL, DuPont Displays, Konica Minolta, LG Display, Samsung SMD, Seiko Epson, Sony, Tohoku Pioneer and Toyota Industries. Universal Display was founded by Sherwin I. Seligsohn in April 1985 and is headquartered in Ewing, New Jersey.
1 Year Total Return Performance
This total returns chart shows the returns to an investor from both price appreciation and dividends (dividends are assumed to be reinvested). Universal Display Corporation is up N/A over the last year vs S&P 500 Total Return up N/A, AU Optronics down N/A, and LG Display down N/A.
- PANL Total Returns
- ^SPXTR Total Returns
- AUO Total Returns
- LPL Total Returns
Fundamentals
Fundamental analysis of a business involves analyzing its financial statements and health, its management and competitive advantages. The key financial statements of a company are the income statement, balance sheet and cash flow statement.
Cash Flow Statement View Statement
You may also be interested in these PANL related companies
Pro Strategies Featuring PANL
Did Universal Display Corporation make it into our Pro Portfolio Strategies?
PANL Charts
- Accounts Payable
- Accounts Receivable
- Accruals Pro
- Altman Z-Score Pro
- Asset Utilization
- Beneish M-Score Pro
- Beta Pro
- Book Value
- Book Value per Share
- Capital Expenditures
- Cash Conversion Cycle Pro
- Cash Div. Payout Ratio TTM Pro
- Cash Financing
- Cash Financing TTM
- Cash Investing
- Cash Investing TTM
- Cash Operations
- Cash Operations TTM
- Cash and Equivalents
- Cash and ST Investments
- Current Ratio
- Days Inventory Outstanding Pro
- Days Payable Outstanding Pro
- Days Sales Outstanding Pro
- Debt to Equity Ratio
- Dividend
- Dividend Yield
- EBITDA Margin TTM Pro
- EBITDA TTM Pro
- EV / EBIT Pro
- EV / EBITDA Pro
- EV / Free Cash Flow Pro
- EV / Revenues Pro
- Earnings Per Share
- Earnings Per Share Growth
- Earnings Per Share TTM
- Earnings Yield
- Effective Tax Rate TTM Pro
- Enterprise Value
- Expenses
- Expenses TTM
- Free Cash Flow
- Free Cash Flow TTM
- Free Cash Flow Yield Pro
- Fundamental Score Pro
- Gross Profit Margin
- Gross Profit TTM
- Income from Cont. Ops Pro
- Interest Expense
- Interest Income
- Inventories
- KZ Index Pro
- Liabilities
- Long Term Debt
- Market Cap
- Net Income
- Net Income TTM
- Net PP&E
- Operating Earnings Yield Pro
- Operating Margin TTM Pro
- Operating PE Ratio Pro
- Other Comprehensive Income Pro
- PE 10 Pro
- PE Ratio
- PE Value Pro
- PEG Ratio
- PS Value Pro
- Payout Ratio TTM Pro
- Price
- Price / Book Value
- Price / Sales Ratio
- Price / Tangible Book Value Pro
- Profit Margin
- R&D Expense
- Receivables Turnover
- Retained Earnings
- Retained Earnings Growth
- Return on Assets
- Return on Equity
- Return on Invested Capital Pro
- Revenue Growth
- Revenue Per Share TTM
- Revenues
- Revenues TTM
- SG&A Expense
- Shareholders Equity
- Shares Outstanding
- Stock Buybacks
- Tangible Book Value Pro
- Tangible Book Value Per Share Pro
- Tangible Common Equity Ratio Pro
- Times Interest Earned TTM Pro
- Total Assets
- Total Return Price
- Valuation (Historical Mult.) Pro
- Valuation Percentage Pro
- Value Score Pro
Other PANL Resources
- Company Website
- Wiki Page
- Investor Relations
- 13F Filings Whale Wisdom
- Call Transcripts Seeking Alpha
- Insider Trading Quote.com
- Institutional Ownership MSN Money
- SEC Filings SEC
- Technical Charts Chart.ly
- Trading Ideas Benzinga
Recent Quotes
| Symbol | Price | Chg | Chg % | Market Cap |
|---|---|---|---|---|
| PANL | 45.46 | -1.01 | -2.17% | 2.07B |
| TZOO | 25.60 | -0.66 | -2.51% | 408.58M |
| JRJC | 2.15 | 0.01 | 0.47% | 47.19M |
| HILL | 1.45 | -0.03 | -2.03% | 83.07M |
| GRRF | 2.95 | 0.00 | 0.00% | 67.05M |
| RVBD | 27.67 | -0.06 | -0.22% | 4.30B |
| OSTK | 6.96 | -0.20 | -2.79% | 162.03M |
| OLCB | 0.99 | -0.01 | -0.99% | 19.52M |
| HLYS | 2.00 | 0.03 | 1.52% | 55.14M |
| CCOI | 17.61 | 0.41 | 2.35% | 811.35M |