

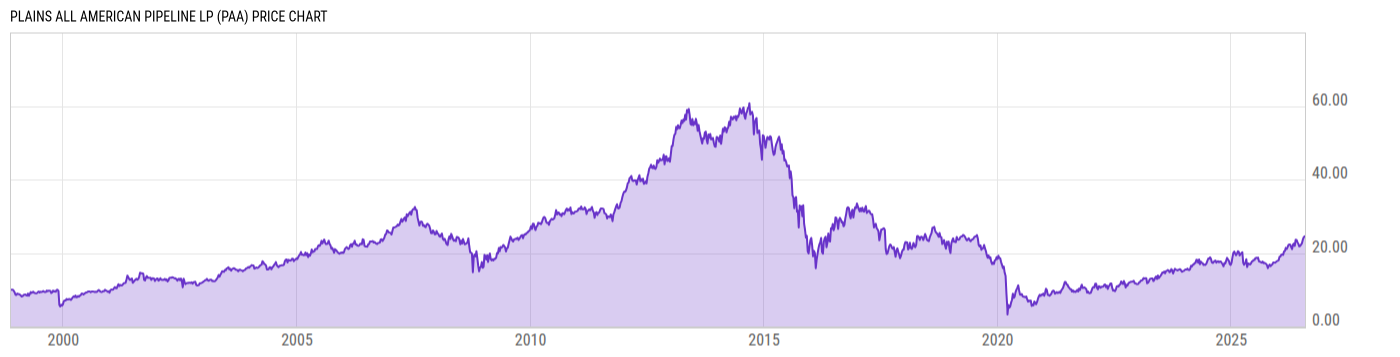
Plains All American Pipeline LP (PAA)
24.57
-0.25
(-1.01%)
USD |
NASDAQ |
Jul 31, 16:00
24.54
-0.03
(-0.12%)
After-Hours: 20:00
Price Chart
Key Stats
| Price and Performance | |
|---|---|
| Market Cap | 17.33B |
| 52 Week High (Daily) | |
| 52 Week Low (Daily) | |
| All-Time High (Daily) | |
| Year to Date Total Returns (Daily) | |
| 1 Month Total Returns (Daily) | |
| 1 Year Total Returns (Daily) | 45.79% |
| Valuation | |
| PE Ratio | 18.40 |
| PE Ratio (Forward) | |
| PS Ratio | 0.3832 |
| Price to Book Value | 2.292 |
| EV to EBITDA | |
| Dividend | |
|---|---|
| Dividend | 0.4175 |
| Dividend Yield (Forward) | |
| Financials | |
| Revenue (5 Year Growth) | |
| Revenue (Quarterly YoY Growth) | |
| EPS Diluted (5 Year Growth) | |
| EPS Diluted (Quarterly YoY Growth) | |
| Debt to Equity Ratio | 1.206 |
| Return on Equity | |
| Return on Assets | |
| Risk | |
| Beta (5Y) | |
| Max Drawdown (5Y) | 62.73% |
Profile
| Plains All American Pipeline LP engages in the operation of midstream energy infrastructure and provides logistics services for crude oil, natural gas liquids, and natural gas. It operates through the following business segments: Crude Oil and Natural Gas Liquids. The Crude Oil segment includes its crude oil pipelines, crude oil storage and marine terminals, and related crude oil marketing activities. The Natural Gas Liquids (NGL) segment refers to NGL pipelines, NGL storage, natural gas processing and NGL fractionation facilities, and related NGL marketing activities. The company was founded by Greg L. Armstrong in 1981 and is headquartered in Houston, TX. |
| URL | http://www.plains.com |
| Investor Relations URL | N/A |
| HQ State/Province | Texas |
| Sector | Energy |
| Industry | Oil, Gas & Consumable Fuels |
| Equity Style | Small Cap Value |
| Next Earnings Release | Aug. 07, 2026 |
| Last Earnings Release | May. 08, 2026 |
| Next Ex-Dividend Date | N/A |
| Last Ex-Dividend Date | Jul. 31, 2026 |