

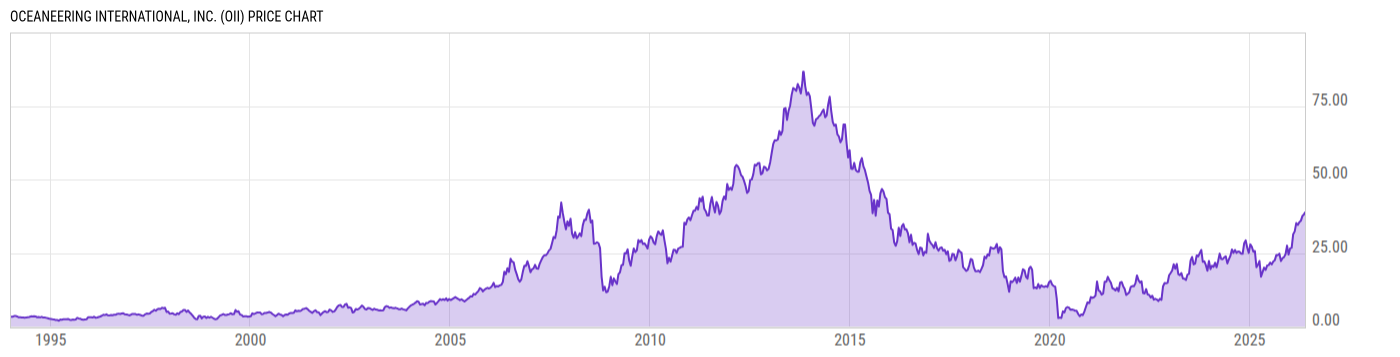
Oceaneering International, Inc. (OII)
39.31
+2.16
(+5.81%)
USD |
NYSE |
Jun 08, 15:35
Price Chart
Key Stats
| Price and Performance | |
|---|---|
| Market Cap | 3.921B |
| 52 Week High (Daily) | |
| 52 Week Low (Daily) | |
| All-Time High (Daily) | |
| Year to Date Total Returns (Daily) | |
| 1 Month Total Returns (Daily) | |
| 1 Year Total Returns (Daily) | 85.01% |
| Valuation | |
| PE Ratio | 11.68 |
| PE Ratio (Forward) | |
| PS Ratio | 1.416 |
| Price to Book Value | 3.543 |
| EV to EBITDA | |
| Dividend | |
|---|---|
| Dividend | -- |
| Dividend Yield (Forward) | |
| Financials | |
| Revenue (5 Year Growth) | |
| Revenue (Quarterly YoY Growth) | |
| EPS Diluted (5 Year Growth) | |
| EPS Diluted (Quarterly YoY Growth) | |
| Debt to Equity Ratio | 0.767 |
| Return on Equity | |
| Return on Assets | |
| Risk | |
| Beta (5Y) | |
| Max Drawdown (5Y) | 74.38% |
Profile
| Oceaneering International, Inc. engages in the provision of engineered services and products, and robotic solutions to the offshore energy, defense, aerospace, manufacturing, and entertainment industries. It operates through the following business segments: Subsea Robotics, Manufactured Products, Offshore Projects Group (OPG), Integrity Management & Digital Solutions (IMDS), and Aerospace and Defense Technologies (ADTech). The Subsea Robotics segment includes remotely operated vehicles, survey services, and ROV tooling businesses. The Manufactured Products segment provides distribution systems, such as production control umbilicals and connection systems made up of specialty subsea hardware, and provides turnkey solutions that include project management, engineering design, fabrication/assembly, and installation of autonomous mobile robotic technology to industrial, manufacturing, healthcare, warehousing, and commercial theme park markets. The OPG segment focuses on subsea project capabilities and solutions. The IMDS segment covers asset integrity management, corrosion management, inspection, and nondestructive testing services. The ADTech segment provides government services and products, including engineering related manufacturing in defense and space exploration activities. The company was founded in 1969 and is headquartered in Houston, TX. |
| URL | http://www.oceaneering.com |
| Investor Relations URL | https://investors.oceaneering.com/ |
| HQ State/Province | Texas |
| Sector | Energy |
| Industry | Energy Equipment & Services |
| Next Earnings Release | Jul. 22, 2026 (est.) |
| Last Earnings Release | Apr. 22, 2026 |
| Next Ex-Dividend Date | N/A |
| Last Ex-Dividend Date | Aug. 23, 2017 |